
Operational cost optimization is the continuous discipline of realigning your spending with business value — cutting what drains resources without return, improving what drives performance, and reinvesting the savings into capabilities that compound over time. If you’re starting from zero, five moves matter most right now: (1) diagnose your actual cost drivers rather than guessing at them, (2) set driver-based targets tied to output metrics, not arbitrary percentage cuts, (3) explicitly protect the capabilities that generate revenue or customer loyalty, (4) launch one high-impact pilot in AP automation or vendor renegotiation to build credibility fast, and (5) assign a governance owner so gains don’t erode quietly over the next two quarters.
- Diagnose first. Map spend to business outcomes before touching a single line item.
- Set driver-based targets. Tie reduction goals to cost-per-unit or cost-per-transaction, not a blanket “cut 10%.”
- Defend growth capabilities. Ring-fence sales capacity, product development, and customer success before trimming elsewhere.
- Launch a pilot. AP automation or a top-vendor renegotiation typically shows measurable results within 30 days.
- Assign governance. Name an owner, set a review cadence, and define escalation paths before you scale anything.
Pro Tip: Before cutting any budget line, ask whether it directly supports revenue generation or customer retention. If it does, find a way to make it more efficient rather than smaller.
Key Takeaways
Operational cost optimization delivers durable savings only when it combines continuous measurement, protected capabilities, and deliberate reinvestment of gains into future capacity.
| Point | Details |
|---|---|
| Optimization vs. cutting | Cost optimization preserves capabilities and reinvests savings; cost-cutting trades long-term capacity for short-term relief. |
| Start with diagnosis | Map cost drivers to business outcomes before acting — misattributed root causes produce the wrong interventions. |
| Measure with guardrails | Track savings vs. baseline AND customer satisfaction, quality, and churn to catch hidden damage early. |
| Govern continuously | Assign a named owner, hold monthly cross-functional reviews, and earmark a portion of savings for reinvestment. |
| POW IT UP accelerates pilots | POW IT UP’s DocuPOW and AuraPOW platforms, combined with custom AI agent engineering, delivered approximately 40% back-office OPEX reduction for one services firm within 90 days. |
Table of Contents
- What does operational cost optimization actually cover?
- The core principles that separate sustainable optimization from one-off cuts
- Which operational levers actually move the needle?
- How do you measure whether your optimization program is working?
- Function-specific playbooks: 30/90/180-day actions
- How do you build a cost optimization program that doesn’t collapse after 90 days?
- Which technology categories actually support cost optimization?
- How POW IT UP helped a services firm cut processing costs by 40%
- Why most cost programs fail to stick
- What POW IT UP can do for your cost optimization program
- Sources
- FAQ
What does operational cost optimization actually cover?
Cost optimization, as Gartner frames it, is a continuous, business-focused discipline that drives spending reduction while maximizing business value. That framing matters because it separates optimization from its cheaper cousin: cost-cutting.
Cost-cutting is a tactical response to a cash crisis. You slash headcount, freeze travel, and cancel software contracts. It’s fast, it’s visible, and it frequently destroys the capabilities you’ll need when conditions improve. IBM describes cost optimization as managing and reducing expenses while maintaining or improving quality — a fundamentally different intent. The goal isn’t to spend less; it’s to spend better.
The scope is genuinely multidimensional:
- Financial: unit economics, margin by product/customer/channel, working capital efficiency
- Operational: process cycle times, error rates, throughput, capacity utilization
- Technological: software rationalization, automation ROI, cloud spend governance
- Organizational: spans of control, decision latency, redundant coordination layers
| Dimension | Cost-Cutting | Cost Optimization |
|---|---|---|
| Intent | Reduce spend immediately | Align spend with value creation |
| Time horizon | Weeks to months | Ongoing, multi-year |
| Risk to capability | High — often cuts muscle with fat | Managed — protects growth drivers |
| Measurement | Budget variance | Cost per unit, ROI, quality metrics |
| Reinvestment logic | None — savings go to the bottom line | Savings fund future capabilities |
Two examples clarify the difference in practice. A smart optimization: the same company automates its freight invoice reconciliation, reduces a five-person manual process to one reviewer, saves $200,000, and redeploys the four freed staff to proactive account management.
The second scenario costs more to implement upfront. It also compounds.
The core principles that separate sustainable optimization from one-off cuts
Deloitte frames cost optimization as freeing capital for long-term growth while preserving speed, innovation, and resilience — not simply reducing headcount or inputs. That framing points to four operating principles every leader should internalize before touching a budget.
Systematically reduce low-value spend. Not all spend is equal. Auto-renewing contracts, redundant inventory buffers, and freight premiums from weak process architecture are common culprits that Grant Thornton’s Q1 2026 CFO survey identifies as frequently misattributed to labor issues.
Improve enterprise performance. Reducing cost and improving output aren’t opposing forces. Process redesign, automation, and better capacity planning often deliver both simultaneously. The discipline is finding where performance gaps are costing you money, not just where the budget looks large.
Reinvest savings deliberately. Savings that disappear into the general ledger don’t build competitive advantage. Explicitly earmark a portion of realized savings for data infrastructure, AI capabilities, or platform modernization. This is what separates a cost program from a cost culture.
Shifting toward variable cost structures — through outsourcing, consumption-based contracts, and flexible staffing models — builds resilience without sacrificing scale.
These four principles interact through governance and measurement. Without a named owner and a regular review cadence, even well-designed programs drift. Grant Thornton’s survey data notes that A significant share of finance leaders indicate they will not cut costs in the near term, signaling a shift from reactive cost-cutting to proactive cost optimization.
Which operational levers actually move the needle?
Not all levers are equal. The ones below are ranked roughly by expected impact and time-to-measurable-savings, drawing on practitioner evidence from Stripe’s cost reduction guide and practitioner literature.
-
Vendor renegotiation typically delivers cost savings on targeted contracts within a short timeframe. Your top 10 vendors by spend almost always have room to move on price, payment terms, or bundled scope. Consolidating purchases and offering longer commitments in exchange for discounts is the fastest path to realized savings without operational disruption.
-
SaaS rationalization (30–60 days, 15–25% software spend reduction). Audit every software subscription for actual usage. Most mid-market companies are paying for 20–40% more licenses than active users. Cancel, downgrade, or consolidate before the next renewal cycle.
-
AP automation (60–90 days). Automating accounts payable processing reduces manual keying errors, accelerates invoice cycle times, and unlocks early-payment discounts that most manual AP teams miss entirely. This is one of the highest-control AI use cases with predictable, measurable ROI.
-
Process redesign using Lean or Kaizen principles. A structured academic review confirms that continuous process improvement, benchmarking, and process mapping are effective at raising efficiency — but they’re time-consuming. Budget 60–180 days for meaningful gains and resource the mapping and simulation work properly.
-
SKU and customer pruning. Low-margin SKUs and unprofitable customer segments consume disproportionate operational capacity. A disciplined profitability analysis often reveals that 20% of your product catalog or customer base generates negative contribution margin after fully loaded costs.
-
Zero-based budgeting (ZBB). Rather than incrementing last year’s budget, ZBB requires every cost center to justify spend from zero each cycle. It’s disruptive to implement but surfaces embedded waste that incremental budgeting never touches.
-
Preventive maintenance programs. Unplanned equipment downtime costs 5–10x more than scheduled maintenance in most manufacturing and logistics environments. A shift from reactive to preventive maintenance reduces emergency repair costs and extends asset life.
-
Energy and facilities consolidation. Renegotiating utility contracts, consolidating underutilized office space, and implementing energy management systems typically yield 10–15% reductions in facilities operating costs.
Pro Tip: The most commonly misapplied lever is headcount reduction. Cutting people is visible and fast, but it often destroys institutional knowledge and process capacity that takes 12–18 months to rebuild. Exhaust automation, vendor, and process levers first — then evaluate workforce structure.
How do you measure whether your optimization program is working?
Measurement is where most cost programs fail. Leaders declare victory on budget variance while customer satisfaction quietly erodes and process quality degrades. A real measurement framework tracks savings, performance, and guardrails simultaneously.
| KPI | Why It Matters | How to Calculate |
|---|---|---|
| Savings vs. baseline | Proves realized value against a counterfactual | (Baseline cost period) minus (actual cost period), adjusted for volume |
| Operating cost as % of revenue | Tracks efficiency relative to scale | Total operating expenses divided by total revenue |
| Cost per transaction | Measures process efficiency at unit level | Total process cost divided by transaction volume |
| Cycle time | Identifies process bottlenecks and throughput gains | Average elapsed time from process start to completion |
| FTEs per unit of output | Tracks workforce productivity | Headcount allocated to a process divided by output volume |
| Customer satisfaction score | Guardrail against capability erosion | NPS, CSAT, or CES tracked monthly |
| ROI and payback period | Justifies continued investment | Net savings divided by implementation cost; months to break even |
Attribution checklist. Before claiming savings, confirm: (a) the baseline period is volume-adjusted so you’re not claiming savings that came from lower demand; (b) one-time costs of the initiative are fully loaded into the ROI calculation; © the savings are recurring, not a one-time renegotiation gain that won’t repeat.
Guardrails matter as much as the savings metrics. Stripe recommends tracking both financial and non-financial impacts to avoid unintended damage to customer experience or quality.
Function-specific playbooks: 30/90/180-day actions
General principles don’t get implemented. Role-specific checklists do. Here’s what each function should prioritize.
Finance
- 30 days: Audit all auto-renewing contracts and SaaS subscriptions; identify the top 10 vendors by spend for renegotiation; establish a cost-per-transaction baseline for AP and payroll processing.
- 90 days: Implement driver-based budgeting for at least two cost centers; deploy AP automation for invoice matching and approval routing; build a rolling 13-week cash flow forecast.
- 180 days: Move to zero-based budgeting for discretionary spend categories; integrate predictive forecasting tools that shorten forecast cycles; establish a monthly cost governance review with CFO sign-off.
Pitfall: Finance teams often optimize their own processes while leaving the largest cost drivers — procurement, operations, IT — uncoordinated. Finance should own the measurement framework and the cross-functional cost governance cadence, not just its own budget.
IT
- 30 days: Run a cloud spend audit using tagging and cost-allocation reports; identify unused or oversized compute instances; cancel or downgrade unused SaaS licenses.
- 90 days: Implement cloud cost management tooling with automated rightsizing recommendations; consolidate redundant tools across the stack; establish a software procurement approval gate.
- 180 days: Shift variable workloads to consumption-based cloud pricing; deploy automation for routine IT operations (patching, provisioning, monitoring alerts); build a technology TCO model that includes hidden integration and maintenance costs.
Pitfall: IT cost cuts that eliminate security tooling or monitoring capacity create risks that cost far more to remediate than the savings generated. Security and observability are non-negotiable guardrails.
Procurement
- 30 days: Segment the supplier base by spend and strategic importance; identify consolidation opportunities across business units buying from the same vendors independently.
- 90 days: Renegotiate top-10 supplier contracts with volume commitments and payment-term optimization; implement contract analytics to surface auto-renewal risks and missed discount clauses.
- 180 days: Move to preferred-supplier programs with standardized terms; deploy e-procurement tooling to enforce compliance and capture spend data; establish supplier scorecards with cost and quality metrics.
Pitfall: Procurement teams that optimize purely on unit price often increase total cost of ownership through quality failures, delivery delays, and supplier relationship damage. Evaluate total landed cost, not just invoice price.
Operations
- 30 days: Map the three highest-volume processes end-to-end; identify manual handoffs, rework loops, and wait times; establish cycle time and error rate baselines.
- 90 days: Apply Lean or Kaizen principles to the highest-waste process; pilot automation for one repetitive, rule-based task; implement preventive maintenance scheduling for critical equipment.
- 180 days: Scale process improvements across the operation; deploy process mining tools to continuously surface new inefficiency patterns; build a continuous improvement cadence with cross-functional ownership.
Pitfall: Operations improvements that reduce headcount without redeploying staff to higher-value work create morale damage and institutional knowledge loss. Plan redeployment paths before announcing changes.
HR
- 30 days: Analyze workforce cost by function against output metrics; identify spans of control anomalies and redundant coordination layers; audit benefits utilization to find unused or over-provisioned programs.
- 90 days: Redesign job architectures to reduce management layers where spans are too narrow; implement workforce planning tools that model cost against demand scenarios; automate routine HR transactions (onboarding, PTO, compliance reporting).
- 180 days: Build a skills-based workforce model that reduces dependency on external contractors for capabilities you use repeatedly; establish a workforce cost-per-output metric tracked quarterly.
Pitfall: HR cost programs that focus only on headcount reduction miss the larger opportunity in workforce productivity.
Customer and service
- 30 days: Segment customers by revenue, margin, and service cost; identify the bottom 10–15% by contribution margin for repricing or offboarding conversations.
- 90 days: Automate tier-1 customer inquiries through AI-assisted service tools; build a self-service knowledge base that deflects routine support volume; establish cost-per-resolution as a tracked metric.
- 180 days: Redesign service delivery tiers so high-cost support is reserved for high-value customers; deploy customer health analytics to identify churn risk before it becomes a revenue problem.
Pitfall: Customer-facing cost cuts are the highest-risk category. Any reduction in service quality that increases churn by even 1–2 percentage points typically costs more in lost revenue than the operational savings generated.
How do you build a cost optimization program that doesn’t collapse after 90 days?
Most cost programs produce a burst of savings in the first quarter, then quietly drift back toward baseline as competing priorities crowd out the governance work. The fix is treating optimization as a program with a phased roadmap and permanent governance, not a project with an end date.
Phase 1: Assess (weeks 1–4). Map your full cost base to business outcomes. Identify the top 20 cost drivers and classify each as value-adding, necessary overhead, or low-value spend. Use process mining or spend analytics tools to get to data-driven answers rather than opinions.
Phase 2: Prioritize (weeks 5–8). Score opportunities by expected savings, implementation complexity, and risk to capability. Build a portfolio of initiatives across a 30/90/180-day horizon. Assign an owner to each initiative with clear success criteria.
Phase 3: Pilot (weeks 9–16). Launch two to three high-confidence pilots. AP automation, a top-vendor renegotiation, and one process redesign are typical first choices. Measure rigorously against the baseline established in Phase 1.
Phase 4: Scale (months 4–9). Expand pilots that hit their targets. Apply lessons from pilots to adjacent processes. Begin cross-functional coordination so Finance, IT, and Operations are moving in the same direction.

Phase 5: Govern (ongoing). Establish a monthly cost governance review with cross-functional representation. Define decision rights: who can approve new initiatives, who can pause underperforming ones, and who escalates when guardrail metrics are breached.
Governance model essentials:
- A named Cost Optimization Lead (often the CFO or COO) with cross-functional authority
- A steering committee that meets monthly and reviews savings vs. baseline, initiative status, and guardrail metrics
- Clear escalation paths when an initiative threatens quality, customer satisfaction, or compliance
- A reinvestment committee that allocates a defined percentage of realized savings to future capability investments
This gives you a response mechanism for unexpected cost pressures without touching critical capabilities.
Risk mitigation requires explicit monitoring triggers. If employee engagement scores drop more than 10 points during a workforce optimization initiative, pause and investigate before continuing. If a process automation pilot increases error rates rather than reducing them, it needs redesign before scaling. Treat these triggers as automatic review gates, not optional check-ins.
Which technology categories actually support cost optimization?
Technology enables optimization but doesn’t replace the underlying discipline. The categories below address specific problems; buying tools without the process foundation to support them is a reliable way to add cost rather than reduce it.
-
Process mining (e.g., Celonis, SAP Signavio). Analyzes event logs from your ERP, CRM, and workflow systems to map actual process flows — not the idealized versions in your documentation. Surfaces rework loops, bottlenecks, and compliance deviations that manual analysis misses. Typical improvement: 20–40% cycle time reduction in targeted processes.
-
RPA and AI automation. Automates rule-based, high-volume transactional work: invoice processing, data entry, report generation, compliance checks. The ROI is most predictable in AP automation, contract analytics, and predictive forecasting — Grant Thornton cites examples where automation shortened forecast cycles from six weeks to two days and increased early-payment discount capture rates significantly.
-
Contract analytics platforms. Scan contract repositories to surface auto-renewal dates, missed discount clauses, and non-standard terms. Most organizations have 20–30% of their contracts renewing automatically without review — this category pays for itself quickly.
-
Cloud cost management tools (e.g., AWS Cost Explorer, CloudHealth, Apptio). Provide spend visibility, rightsizing recommendations, and anomaly detection for cloud infrastructure. Essential for any organization spending more than $500,000 annually on cloud services.
-
FP&A and rolling forecast platforms (e.g., Anaplan, Planful, Workday Adaptive Planning). Replace static annual budgets with rolling forecasts that update as business conditions change. Reduce forecast cycle time and improve the accuracy of scenario planning for cost decisions. For guidance on selecting the right analytics partner for your finance and operations teams, the evaluation criteria matter as much as the platform itself.
Vendor selection checklist:
- Data footprint: what systems does the tool need to connect to, and how complex is that integration?
- TCO: include implementation, training, ongoing licensing, and internal maintenance costs — not just the subscription fee
- Time-to-value: how long before the tool produces actionable output? Anything beyond 90 days for a pilot is a red flag
- Integration complexity: tools that require custom connectors to every system in your stack create hidden long-term costs
- Change management requirements: who needs to change their workflow for this tool to deliver value?
Pro Tip: Start pilots with AP automation, contract analytics, or predictive forecasting before broader AI initiatives. These are high-control use cases where the data is structured, the success metrics are clear, and the ROI is measurable within a quarter. Broader, experimental AI programs can follow once you’ve built internal confidence and data governance discipline.
For a detailed breakdown of AI automation ROI across common business processes, the TCO components and payback timelines vary significantly by use case and company size.
How POW IT UP helped a services firm cut processing costs by 40%
A mid-market professional services firm — roughly 200 employees, operating across three U.S. states — came to POW IT UP with a familiar problem: their back-office operations had grown organically alongside the business, and what worked at 50 employees was now a collection of manual handoffs, duplicate data entry, and approval bottlenecks that consumed 14 FTEs across finance and operations.
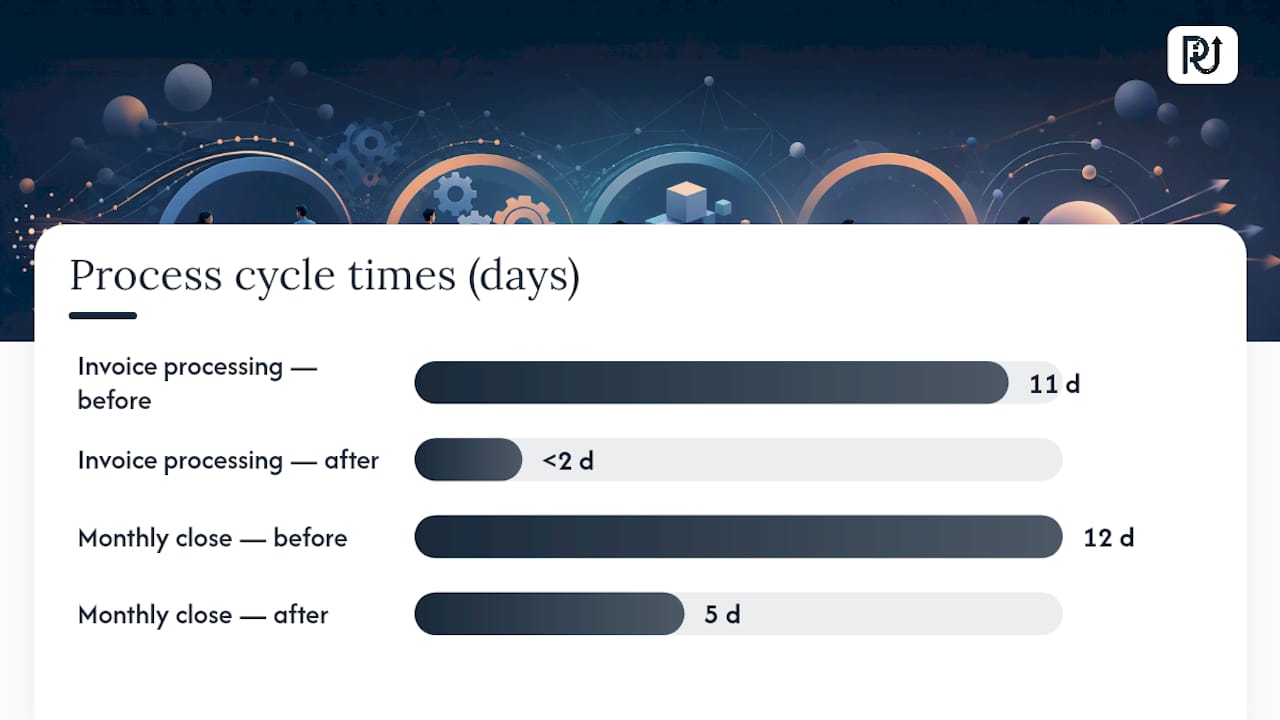
The challenge. Invoice processing took an average of 11 days from receipt to payment approval. Monthly financial close took 12 days. The firm’s leadership knew the problem was process architecture, not headcount — but they didn’t have the internal engineering capacity to redesign and automate it.
POW IT UP’s process:
- Discovery (weeks 1–2). Mapped all finance and operations workflows using process mining on ERP event logs. Identified six high-waste handoff points and quantified the cost of each.
- Design (weeks 3–4). Designed an automated workflow architecture using AI agents for invoice ingestion, validation, and routing. Integrated with the firm’s existing ERP without replacing it.
- Engineering (weeks 5–8). Built and tested the automation using POW IT UP’s DocuPOW platform for document reading and validation, and AuraPOW for portfolio monitoring and operational health tracking.
- Deploy (weeks 9–10). Phased rollout starting with AP automation, then contract renewal alerts, then financial close acceleration.
- Measure (weeks 11–16). Tracked savings vs. baseline across all five KPIs established in discovery.
Results (anonymized, 90-day post-deployment):
- Invoice processing time: from 11 days to under 2 days
- Early-payment discount capture: from 40% to 91% of eligible invoices
- Monthly financial close: from 12 days to 5 days
- FTEs reallocated from manual processing to higher-value analysis: 6 of 14
- Overall back-office OPEX reduction: approximately 40%
Lessons learned:
- The biggest ROI came from the combination of DocuPOW’s document intelligence and automated approval routing — neither alone would have achieved the same result.
- Change management was the hardest part. The team needed two weeks of parallel running before they trusted the automated outputs.
- Governance mattered: AuraPOW’s monitoring dashboards gave the CFO real-time visibility into process health, which accelerated executive confidence and buy-in for the next phase.
Why most cost programs fail to stick
Cost optimization programs that produce real, durable gains share one characteristic that’s rarely discussed in the frameworks: they treat cost discipline as a cultural norm, not a project deliverable.
The typical failure pattern is predictable. A cross-functional team runs a 90-day initiative, realizes meaningful savings, declares success, and disbands. Twelve months later, costs have crept back to baseline because no one owns the governance, the measurement infrastructure was never embedded into regular operations, and the reinvestment logic was never formalized. The savings were real — they just weren’t permanent.
What actually sustains gains is cross-functional accountability with teeth. Finance owns the measurement framework and the baseline. Operations owns the process improvement cadence. IT owns the automation infrastructure. Procurement owns the supplier governance. And the CFO or COO holds a monthly review where every function reports against its targets — not as a performance review, but as a coordination mechanism for surfacing new opportunities and catching early warning signals.
Two leadership behaviors that compound over time: first, explicitly linking cost savings to reinvestment decisions so teams see the connection between efficiency gains and new capabilities. Second, celebrating process improvements publicly, not just headcount reductions. The cultural signal that “we optimize how we work” is fundamentally different from “we cut when we have to.”
The third behavior is the hardest: protecting the space for innovation even during a cost program. The organizations that emerge from optimization cycles stronger are the ones that ring-fenced R&D, product development, and customer success while trimming everything else. Cost discipline and growth investment aren’t in tension — but they require deliberate governance to coexist.
What POW IT UP can do for your cost optimization program
The levers in this guide — AP automation, contract analytics, process redesign, predictive forecasting — all require engineering capacity that most operations teams don’t have in-house. POW IT UP builds and deploys the custom AI agents and automation infrastructure that turn these levers from concepts into measurable savings.
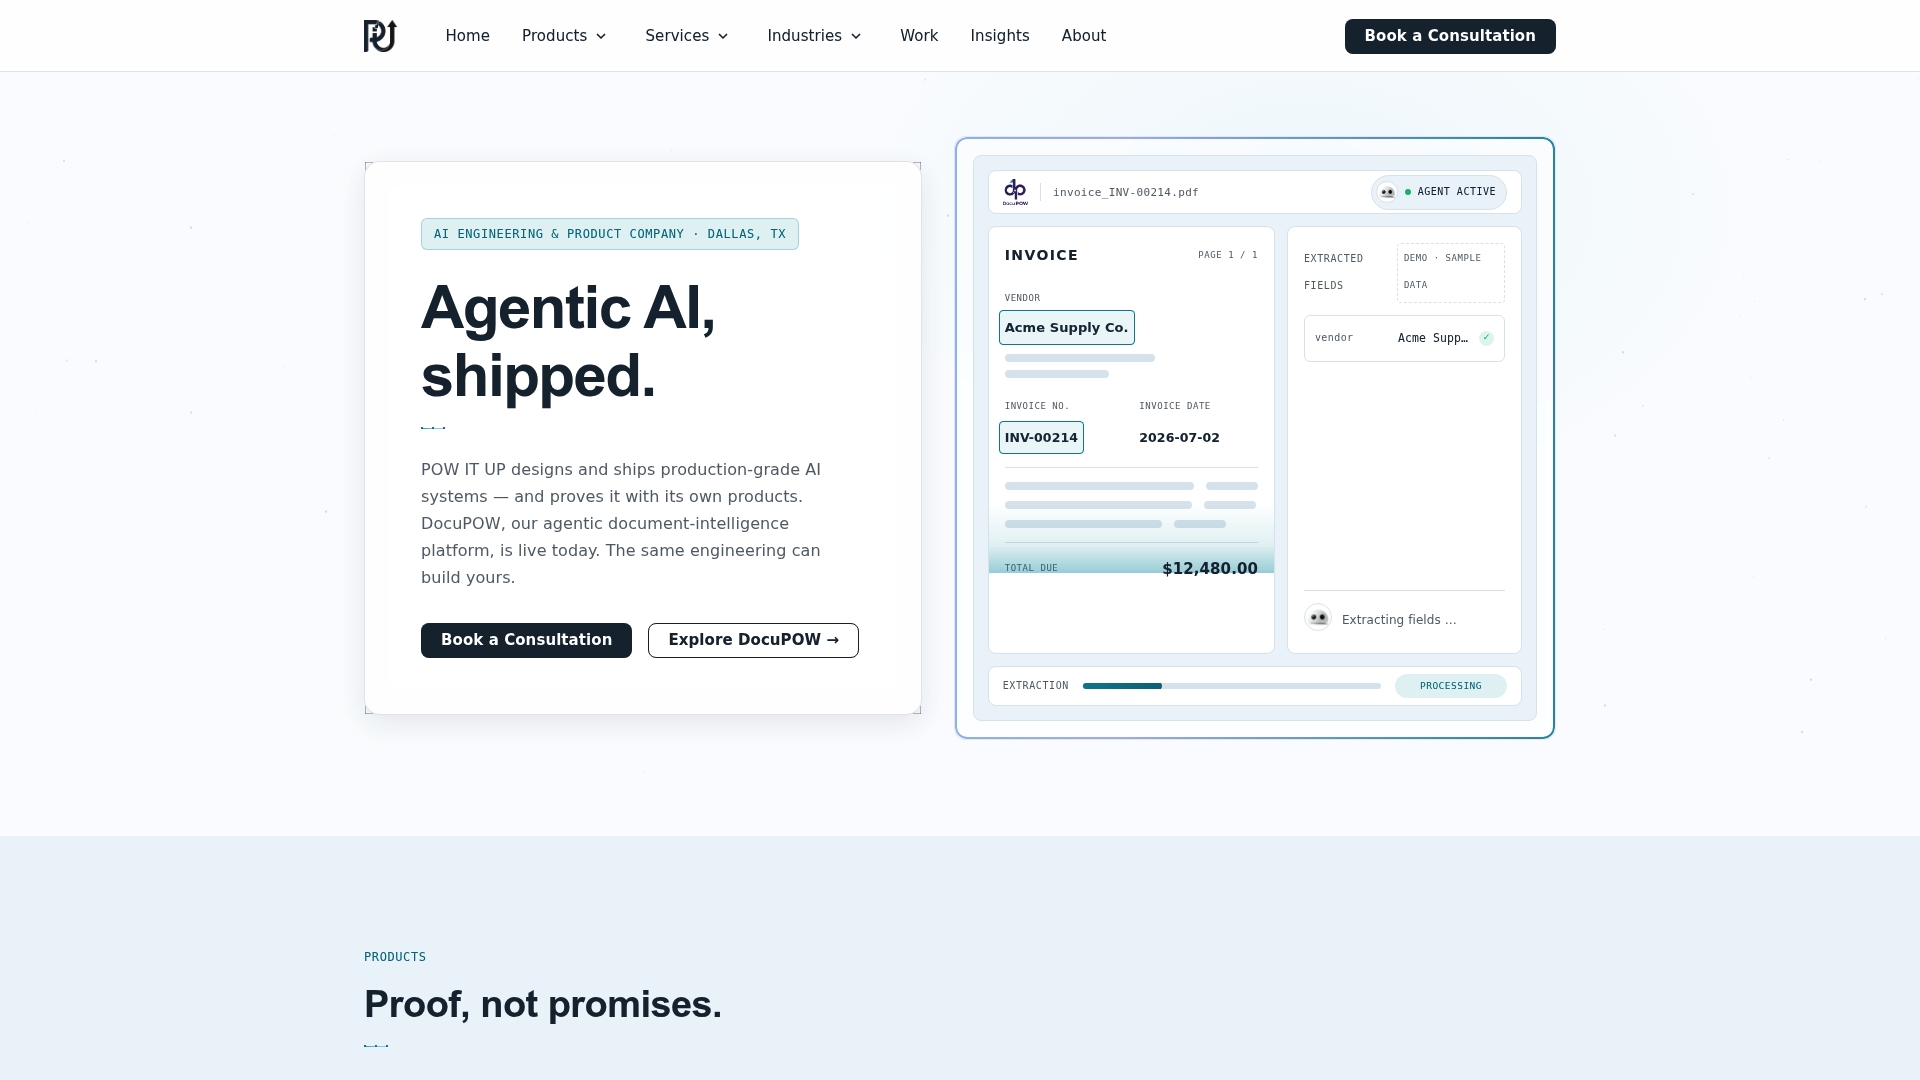
DocuPOW handles document intelligence and validation at scale, eliminating the manual processing bottlenecks that inflate AP and compliance costs. AuraPOW provides portfolio monitoring and operational health analytics so your leadership team has real-time visibility into cost performance across functions. POW IT UP’s AI automation services cover the full engagement path: discovery and process mapping, custom agent engineering, phased deployment, and ongoing governance support.
Engagements typically begin with a focused pilot — AP automation, contract analytics, or a specific back-office workflow — scoped to deliver measurable results within 60–90 days. From there, POW IT UP scales the automation infrastructure across your operation without requiring a corresponding increase in headcount. If you’re ready to move from planning to implementation, book a demo and see how the platform maps to your specific cost drivers.
Sources
- Cost Optimization
- A guide to cost reduction strategies for businesses | Stripe
- Business process improvement methods and techniques — Orga (DOI)
FAQ
What is operational cost optimization?
Operational cost optimization is the ongoing practice of reducing business expenses while maintaining or improving performance quality, then reinvesting those savings into capabilities that drive future growth. It differs from cost-cutting in that it protects strategic capabilities rather than eliminating them.
What are the four pillars of cost optimization?
Definitions vary across frameworks, but a widely used structure covers four dimensions: reducing low-value spend, improving enterprise performance, reinvesting savings in future capabilities, and managing the balance between fixed and variable cost structures. Gartner and Deloitte both emphasize that levers and priorities differ significantly by function.
How do you decrease operating expenses (OPEX)?
The fastest OPEX reductions typically come from vendor renegotiation, SaaS license audits, and AP automation — all achievable within 30–90 days. Longer-horizon reductions come from process redesign using Lean or Kaizen methods, zero-based budgeting, and workforce productivity improvements tied to automation.
What are examples of operational costs?
Operational costs include employee wages and benefits, rent and facilities expenses, software subscriptions, supplier and vendor payments, logistics and freight, energy and utilities, and the cost of processing transactions like invoices, contracts, and customer service interactions. These are the recurring expenses required to run the business day-to-day, distinct from capital expenditures.
How long does it take to see results from a cost optimization program?
Vendor renegotiation and SaaS audits can produce measurable savings within 30 days. AP automation and process redesign typically show results within 60–90 days. Larger structural changes — zero-based budgeting, workforce redesign, and full process transformation — generally require 6–12 months to deliver their full impact.