

Map one core process today, measure cycle time against lead time, fix the single step where work piles up, then pilot automation on that constraint. That sequence, done in 72 hours of focused effort, is the fastest path to real throughput gains.
Three actions you can take right now:
- Day 1: Gather your process owner and two frontline team members. Walk the actual process, not the documented one, and sketch a swimlane diagram capturing every handoff.
- Day 2: Pull timestamps from your system logs or CRM and calculate cycle time and lead time for 10–20 recent jobs. The step with the widest gap is your bottleneck.
- Day 3: Pick one pilot target — the highest-frequency, most measurable constraint — and scope a 6–8 week automation test.
Recommended next step: Run a scoped pilot with POW IT UP. If document processing or portfolio monitoring is involved, DocuPOW and AuraPOW are purpose-built for exactly those constraints.
Key Takeaways
Eliminating operational bottlenecks requires a disciplined sequence: map the real process, measure baseline KPIs, simplify before automating, assign clear ownership, and monitor continuously.
| Point | Details |
|---|---|
| Map before you fix | Walk the real process with frontline workers and build a swimlane and VSM before changing anything. |
| Queue time dominates | Queue time accounts for 60–80% of total cycle time; measure WIP and lead time gaps to find the true constraint. |
| Simplify first, then automate | Removing redundant steps and approvals often cuts cycle time significantly before any automation is deployed. |
| Exploit before you elevate | Roughly 58% of constraints are process inefficiencies, not capacity gaps; fix the process before adding resources. |
| Pilot with POW IT UP | POW IT UP’s scoped pilots use DocuPOW and AuraPOW to target document and portfolio bottlenecks with measurable KPIs agreed upfront. |
Table of Contents
- What are operational bottlenecks and why do they cost you more than you think?
- How do you identify where your bottlenecks actually are?
- Which metrics give you a reliable baseline before you change anything?
- How do you decide which bottleneck to fix first?
- What does a practical step-by-step framework for fixing bottlenecks look like?
- When should you use a workflow tool, RPA, or agent-based AI?
- What does a solid pilot launch checklist look like?
- How do you run a pilot and calculate whether it actually worked?
- What are the most common mistakes teams make when fixing bottlenecks?
- How POW IT UP approaches bottleneck elimination — and what one pilot looked like
- Why the human side of bottleneck elimination matters more than the technology
- POW IT UP’s pilot offer: what you get and what to do next
- Sources
- FAQ
What are operational bottlenecks and why do they cost you more than you think?
A bottleneck, as Investopedia defines it, is a point of congestion that slows or stops production flow. Short-term bottlenecks are temporary — a sick employee, a system outage. Long-term bottlenecks stem from process design, equipment, or policy limitations and quietly compound every day you leave them unaddressed.
The Theory of Constraints, developed by Eliyahu Goldratt, makes the mechanics clear: the bottleneck step sets the maximum throughput of the entire system. Every other step’s capacity is irrelevant until you fix the constraint. Speeding up a non-bottleneck step just creates more work waiting at the bottleneck.
The business impacts are direct and measurable:
- Slower lead times. Customers wait longer because work queues at the constrained step, not because the whole team is slow.
- Higher operating costs. Staff upstream of the bottleneck produce work that sits idle, burning labor cost without generating output.
- Lower customer satisfaction. SLA misses and unpredictable delivery erode trust faster than almost any other operational failure.
- Wasted capacity. Downstream steps are starved of work, leaving expensive resources underutilized.
A concrete example: a financial services firm’s loan-processing team completes document intake in two hours, but a single compliance reviewer handles every file manually. Forty files queue up daily. Lead time stretches to four days even though the actual processing work takes under three hours total. The reviewer is the bottleneck, and every other team member’s speed is irrelevant until that step changes.
How do you identify where your bottlenecks actually are?
Process mapping almost always reveals hidden handoffs and redundant steps that no one documented. The key is observing the real process, not the idealized version in your procedure manual.
A one-day discovery workshop, step by step:
- Invite the right people. Include the process owner, two or three frontline workers who do the actual work, and one person from IT or systems. Skip senior managers who only see the process from reports.
- Walk the process in real time. Observe a live transaction or job from start to finish. Note every handoff, every wait, every workaround the team has invented.
- Create a swimlane diagram. Map each step to the person or system responsible. Swimlanes expose handoffs that are invisible in a simple flowchart.
- Sketch a value stream map (VSM). Add time data to each step: processing time and wait time. The VSM makes queue accumulation visible at a glance.
- Draw a queue-depth sketch. At the end of each day for three days, count how many items are waiting at each step. The step with the deepest, most consistent queue is your constraint.
- Pull quantitative data. System logs, ERP timestamps, CRM activity records, and WIP counts give you the numbers to confirm what observation suggests.
- Combine with qualitative evidence. Brief interviews and shadowing sessions surface workarounds and informal fixes that never appear in system data.
Measuring cycle time versus lead time for each step is the most reliable analytical method. The step with the largest gap between the two is almost certainly queue-driven, which means the fix is different from a step that is simply slow to process.
Which metrics give you a reliable baseline before you change anything?
Automation without a baseline risks amplifying waste rather than removing it. Establish your numbers first. Here are the six metrics that matter most, with their definitions and collection methods:
| Metric | Definition / Formula | How to Collect | Target (Pilot Goal) |
|---|---|---|---|
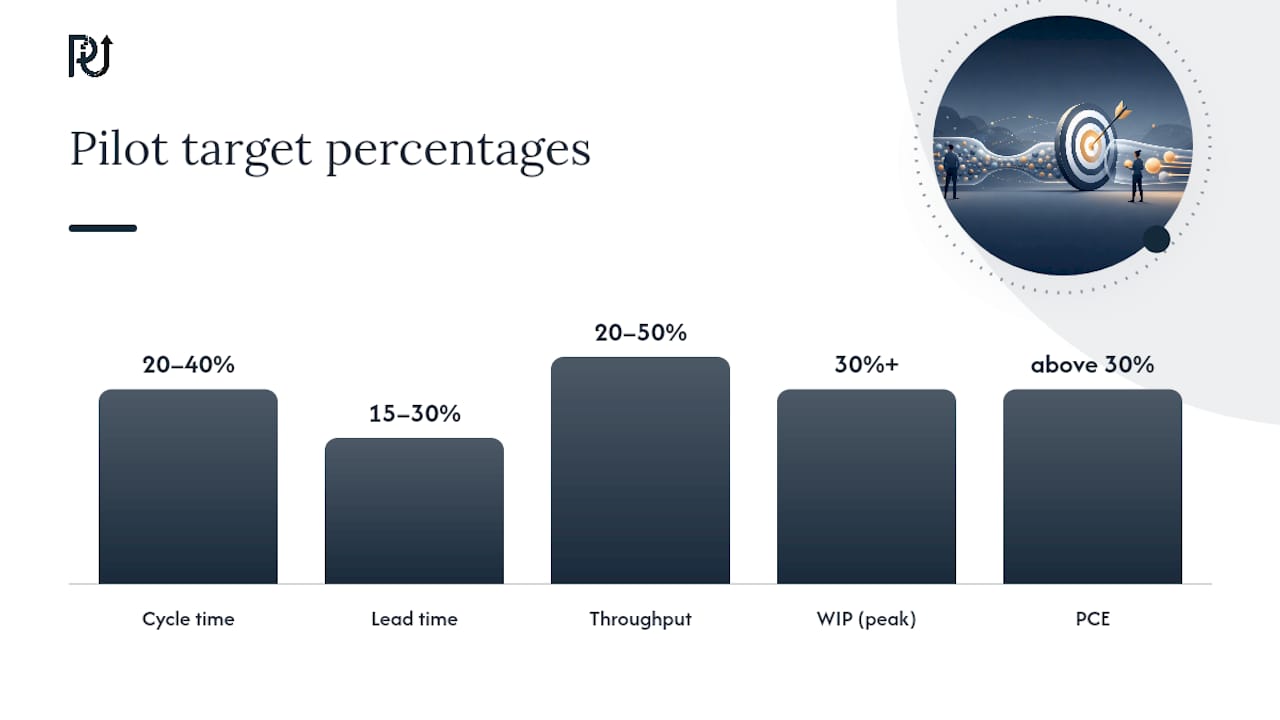
| Cycle time | Time from work start to completion at one step | Timestamps from system logs or manual time-log | Reduce by 20–40% at bottleneck |
| Lead time | Total elapsed time from request to delivery | Start/end timestamps across the full process | Reduce by 15–30% overall |
| Throughput | Units completed per unit of time (e.g., per day) | Count completed jobs from ERP/CRM reports | Increase by 20–50% at bottleneck |
| Work in progress (WIP) | Items currently in process or waiting | Daily queue count at each step | Reduce peak WIP by 30%+ |
| Utilization | Active processing time ÷ total available time | Time-log or system activity reports | Keep bottleneck below capacity limits |
| Process cycle efficiency (PCE) | Value-added time ÷ total lead time | VSM data; PCE below 25% signals significant waste | Increase PCE above 30% |
How to collect quickly: Sample 10–20 recent jobs. Pull timestamps from whatever system touches the work — your CRM, ERP, ticketing system, or email threads. If no system captures timestamps, run a manual time-log for one week using a shared spreadsheet. Add a brief survey (five questions, five minutes) to capture qualitative context: where do people feel stuck, what workarounds exist, and what breaks most often.
Queue time frequently accounts for a large portion of total cycle time in operations. That means most of your lead time is waiting, not working.
Measurement checklist for pilot readiness:
- [ ] Baseline cycle time and lead time captured for 10+ jobs
- [ ] WIP count recorded at each step for at least three days
- [ ] Throughput rate calculated for the past 30 days
- [ ] Utilization estimated at the suspected bottleneck step
- [ ] PCE calculated from VSM data
- [ ] Qualitative survey completed by frontline workers
How do you decide which bottleneck to fix first?
Not every constraint deserves equal attention. Prioritize using a simple impact × effort matrix before committing resources.
What counts as impact:
- Throughput effect: how many more units per day would flow if this constraint were removed?
- Cost effect: what is the labor or rework cost sitting at this step weekly?
- SLA risk: how often does this step cause a missed deadline or customer complaint?
What counts as effort:
- Engineering complexity: does a fix require custom integration or just a configuration change?
- Policy change: does fixing it require approval from legal, compliance, or leadership?
- Training load: how much retraining does the team need to adopt the change?
Prioritization checklist for each candidate bottleneck:
- Is the bottleneck visible and measurable with existing data?
- Does it occur frequently (daily or near-daily)?
- Is the fix within the team’s authority to implement without a six-month approval cycle?
- Is the risk of the fix low (reversible, limited scope)?
- Does fixing it directly increase customer-facing throughput or reduce SLA misses?
According to VantagePoint’s operational analysis, a notable portion of constraints in operations are process inefficiencies rather than genuine capacity shortfalls. That means your first fix is more likely a policy change, a removed approval layer, or a batch-size reduction than a headcount addition. A single-manager approval step or an over-batched processing run often functions as a policy bottleneck that yields immediate gains when restructured.
Quick-win guidance: Target high-impact, low-effort fixes for your first pilot. Reserve capacity additions (hiring, equipment) for constraints that remain after you have fully exploited the process fix. The exploit-before-elevate principle from the Theory of Constraints applies directly here.

What does a practical step-by-step framework for fixing bottlenecks look like?
Workflow optimization requires mapping, removing redundant steps, and automating repeatable tasks — in that order. Automating before simplifying locks in the inefficiency at machine speed.
Weeks 0–2: Discovery and baseline
- Run the one-day discovery workshop (swimlane, VSM, queue-depth sketch).
- Collect baseline metrics for all six KPIs using the measurement checklist above.
- Classify the constraint type: capacity, information flow, policy, variability, or complexity.
- Produce a one-page process map and a baseline metrics dashboard. These are the pilot’s starting point.
Weeks 3–8: Pilot
- Simplify first. Remove redundant approvals, consolidate duplicate data-entry steps, and eliminate handoffs that add wait time without adding value. This alone often cuts cycle time by 15–25%.
- Parallelize where possible. Split sequential tasks that have no true dependency. Two reviewers working in parallel on different file types beats one reviewer working sequentially.
- Create input buffers. A small, managed queue feeding the bottleneck step keeps it running at full capacity without starving it during upstream variability.
- Automate the constraint. Apply automation only after steps 5–7 are complete. Automation at this stage accelerates a clean process rather than a broken one. For document-heavy or exception-heavy steps, agent-based automation handles variability that rule-based tools cannot.
- Assign clear ownership. Every automated step needs a named process owner who monitors it, handles exceptions, and owns the KPIs. No owner means no accountability when something drifts.
- Deploy a measurement dashboard. Track daily queue depth, weekly throughput trend, and cycle time at the bottleneck step. Review weekly during the pilot.
Month 3 and beyond: Scale
- Confirm pilot KPIs against baseline. If cycle time dropped and throughput increased, the constraint is resolved.
- Identify the next constraint (the system will surface a new one) and repeat the cycle.
- Formalize the process map and automation spec as living documents. Update them when the process changes.
When should you use a workflow tool, RPA, or agent-based AI?
The right automation class depends on what the constrained step actually does. Applying the wrong tool wastes time and creates maintenance debt.
| Use Case | Automation Class | Best For | Watch Out For |
|---|---|---|---|
| Simple rule-based routing, notifications, approvals | Workflow / BPM tool | Structured, predictable sequences with clear rules | Poor fit for exceptions or variable inputs |
| Repetitive screen-based tasks, copy-paste between systems | RPA (Robotic Process Automation) | Legacy systems with no API; high-volume, low-variation tasks | Brittle to UI changes; high maintenance when screens change |
| High-volume document processing, exception handling, multi-system reasoning | Agent-based AI | Unstructured inputs, variable formats, judgment-required decisions | Requires clean data inputs and governance; higher setup investment |
Pros and cons at a glance:
- Workflow / BPM tools: Fast to deploy, low maintenance, easy for non-technical teams to configure. Limited to structured, predictable logic. Breaks down when inputs vary or exceptions are frequent.
- RPA: Bridges legacy systems without APIs. Good for high-volume, repetitive screen tasks. Maintenance burden is high because any UI change breaks the bot. Poor at handling exceptions without human fallback.
- Agent-based AI: Handles unstructured documents, variable formats, and multi-step reasoning. Automation delivers the highest return when applied to the actual bottleneck, not to upstream or downstream non-constraints. Agent-based systems reduce manual exception queues dramatically when the bottleneck involves document interpretation or complex routing decisions.
A practical example: a logistics company’s invoice-matching step required a clerk to open three systems, compare fields, and flag discrepancies manually. An RPA bot handled the easy matches but broke on format variations. Replacing it with an agent-based system that reads and interprets invoice formats reduced the exception queue by handling variability the RPA could not. The queue that had backed up for days cleared within hours. For a broader view of automation tool categories and how they map to service operations, POW IT UP’s resource library covers the decision framework in detail.
Pro Tip: Apply automation to the bottleneck step specifically. Automating a non-constraint step upstream just fills the bottleneck queue faster — it does not increase system throughput.
What does a solid pilot launch checklist look like?
A pilot without a defined scope and rollback plan is just an experiment with no exit. Structure it before you start.
Pilot checklist:
- [ ] Scope defined: one process, one constraint step, one team
- [ ] Success metrics set: specific targets for cycle time, throughput, error rate, and cost per transaction
- [ ] Sample size agreed: minimum 10–20 transactions per week to generate statistically meaningful data
- [ ] Data access confirmed: system credentials, API keys, and data export rights in place before day one
- [ ] Rollback plan documented: clear trigger conditions and a manual fallback process ready
- [ ] Timeline fixed: 6–8 weeks for the pilot; decision point at week 6
- [ ] Communication plan sent: all affected teams know what is changing, why, and who to contact with issues
Roles and responsibilities:
- Sponsor: a senior leader who owns the business case, removes organizational blockers, and approves resources
- Process owner: the manager responsible for the constrained step; owns KPI targets and accepts the pilot’s output
- Technical lead: designs, builds, and monitors the automation; escalates integration issues
- Support contact: a named person for frontline workers to report problems without going through a ticket queue
Security and data essentials: Confirm data access rights are scoped to the minimum necessary. Identify any PII in the process and document how it is handled. Define integration boundaries — which systems the automation touches and which it does not. Establish an escalation path for incidents: who gets called, in what order, and within what time window.
How do you run a pilot and calculate whether it actually worked?
Structure the measurement before the pilot starts, not after. Teams that define KPI targets upfront make better scale/iterate decisions at the six-week mark.
Target KPIs for a bottleneck elimination pilot:
- Cycle time reduction at the bottleneck step: a credible target is 20–40% reduction from baseline.
- Throughput increase: measure units completed per day; target 20–50% improvement at the constrained step.
- Error and rework rate: track defects or exceptions requiring manual intervention; target a 30–50% drop.
- Cost per transaction: total labor cost for the step ÷ units processed; should fall as throughput rises.
- SLA compliance rate: percentage of jobs completed within the committed lead time; target 90%+ if currently below that.
Sample ROI calculation:
Focused process automation pilots typically show early wins within a few months; enterprise-wide programs often reach positive ROI inside 12 months. Set that expectation with your leadership team before the pilot starts.
Reporting cadence:
- Daily: queue depth at the bottleneck step (a simple count, takes two minutes)
- Weekly: throughput trend, cycle time trend, error rate — reviewed in a 30-minute team standup
- Monthly: full ROI summary comparing actual results to baseline; decision to scale, iterate, or stop
Scale when: cycle time and throughput targets are both met for two consecutive weeks and the error rate is stable or declining.
Pro Tip: Make measurement and governance the project’s first deliverable. Without baseline metrics, teams cannot prove improvement or prioritize correctly.
What are the most common mistakes teams make when fixing bottlenecks?
Pitfalls and their mitigations:
- Automating before simplifying. Automation amplifies whatever process it receives. If the process has redundant steps or unclear rules, automation moves bad work faster rather than fixing throughput. Simplify first, always.
- Unclear ownership. An automated step with no named owner drifts silently. Assign a process owner before go-live, not after something breaks.
- Missing baseline measurement. Without a before-state, you cannot prove the after-state improved. Collect baseline metrics before touching anything.
- Over-batching. Batching work to “save setup time” creates artificial queues. Reduce batch sizes and measure whether throughput increases.
- Ignoring change resistance. Frontline workers who distrust the new process will route around it. Involve them in mapping and testing; their buy-in is not optional.
- Fixing a non-bottleneck. Speeding up a step that is not the constraint does nothing for system throughput. Confirm the constraint with data before committing engineering effort.
Quick signals that the pilot is failing:
- Queue depth at the bottleneck is not declining after two weeks
- Error rate is rising, not falling
- Frontline workers are bypassing the automated step
Immediate corrective actions: Stop the automation, revert to the manual fallback, and run a root-cause session with the process owner and technical lead within 48 hours. Do not extend a failing pilot hoping it will self-correct.
Pro Tip: *Exploit the constraint before you elevate it.
How POW IT UP approaches bottleneck elimination — and what one pilot looked like
POW IT UP’s engagement model follows the same map→measure→simplify→automate→monitor sequence described in this article, but with a structured technical layer that most internal teams cannot staff on their own.
Engagement steps:
- Discovery (Week 1–2): POW IT UP’s team joins your process owner and frontline workers to walk the real process, build the VSM, and establish baseline KPIs.
- Scoped pilot design (Week 2–3): A pilot scope document defines the constraint, success metrics, data access requirements, and rollback plan.
- Agent deployment (Weeks 3–8): For document-heavy constraints, DocuPOW handles document reading, validation, and exception routing. For portfolio and client-health monitoring, AuraPOW tracks signals across accounts and flags anomalies before they become SLA misses. For other constraint types, POW IT UP engineers custom agents matched to the specific process.
- Measure and decide (Week 8): Results are compared against the baseline. The team decides to scale, iterate, or pivot based on actual KPI data.
- Scale (Month 3+): Proven automation is extended to additional process steps or business units, with governance and monitoring in place from day one.
Note: the specific figures above represent the structure of a real engagement type; exact client metrics are held confidential and available on request during a scoped discovery call.
What you need to provide for a pilot: a named process owner, data access to the relevant systems, and a small cross-functional team (two to three people) available for weekly check-ins. POW IT UP supplies the technical lead, automation spec, measurement plan, and agent infrastructure.
For leaders ready to scope an AI-driven automation pilot, the discovery call takes 45 minutes and produces a written pilot scope within five business days.
Why the human side of bottleneck elimination matters more than the technology
The hardest part of eliminating operational bottlenecks is not the process map or the automation spec. It is getting the people who own the broken process to trust that the fix will not make their jobs worse.
Every deployment that has stalled has had the same pattern: the technical work was solid, the metrics were clear, but the process owner or frontline team was not brought in early enough. They found workarounds, logged exceptions manually, and quietly preserved the old process alongside the new one. The automation ran, but the bottleneck did not move because the human process ran in parallel.

The lesson is not that people resist change. It is that people resist change they did not help design. When frontline workers help build the swimlane diagram, they surface the workarounds that never appear in system logs. When they help define the success metrics, they have a stake in the outcome. That early involvement is not a soft skill. It is the difference between a pilot that proves ROI and one that produces a dashboard nobody trusts.
Treat bottleneck elimination as a continuous operating rhythm, not a one-off project. The system will surface a new constraint once you fix the current one. Teams that build the map→measure→fix cycle into their quarterly operating cadence outperform teams that treat it as a crisis response.
POW IT UP’s pilot offer: what you get and what to do next
Fixing a bottleneck without the right technical infrastructure is slow and often incomplete. POW IT UP builds and deploys custom AI agents that target the specific constraint your team has identified, with measurable KPIs agreed before a single line of code is written.
A scoped POW IT UP pilot covers:
- A structured discovery session to confirm your constraint and baseline metrics
- A custom agent build (DocuPOW for document workflows, AuraPOW for portfolio and client monitoring, or a bespoke agent for other constraint types)
- A measurement plan with defined KPI targets and a six-week reporting cadence
The pilot is minimal-risk by design: fixed scope, clear rollback plan, and a go/no-go decision at week six based on actual data. POW IT UP supplies the technical lead, automation spec, and measurement infrastructure. You supply a process owner and data access.
To scope your pilot, visit POW IT UP’s AI integration services page or explore the full automation service offering. A discovery call takes 45 minutes and produces a written pilot scope within five business days.
Sources
The following sources informed this article and offer additional depth on process mapping, bottleneck analysis, and automation strategy:
- Workflow optimization: a guide to streamlining business processes — Slack
- Workflow efficiency — Teamwork
- How to Find and Fix Operational Bottlenecks — Automation Solutions
- How to Find and Fix Operational Bottlenecks (Before They Kill Your Margins) | ERPLite
- How to Streamline Business Processes for Better Efficiency — VantagePoint
- Bottleneck definition and causes — Investopedia
FAQ
What does “operational bottleneck” mean?
An operational bottleneck is the single step in a process where work accumulates faster than it can be completed, limiting the throughput of the entire system. It sets the maximum output rate regardless of how fast every other step runs.
What does it mean to eliminate a bottleneck?
Eliminating a bottleneck means resolving the constraint so that work flows through that step without accumulating. This typically involves simplifying the step, redistributing work, or automating it, then identifying and addressing the next constraint that surfaces.
What is another term for operational bottleneck?
Operations professionals often use “constraint” (from the Theory of Constraints), “chokepoint,” or “process constraint.” In lean manufacturing, the equivalent concept is the “pacemaker process” or the step with the lowest capacity in the value stream.
How do you identify operational bottlenecks?
Measure cycle time and lead time for each process step; the step with the largest gap between the two is typically queue-driven and marks the constraint. Combine that data with a daily WIP count at each step and direct observation of the real process with frontline workers.
How long does it take to see results from bottleneck elimination?
Focused pilots targeting a single constraint typically show measurable cycle time and throughput improvements within 3–6 weeks. Broader ROI, including cost savings and SLA compliance gains, usually becomes clear within 3–6 months of a well-structured pilot.