

TL;DR:
- Automation ROI measures the true financial gains from automation by including five key components, not just labor savings. Most projects deliver a payback within 60 to 120 days with an average 200% ROI in the first year, emphasizing comprehensive measurement and adoption. POWITUP specializes in building scalable automation systems around high-volume workflows that generate measurable, defensible returns from day one.
What is Automation ROI and how do you calculate it?
Automation ROI measures the financial return you get from investing in automation technology, expressed as the net gain divided by the total cost of the investment. Most teams calculate it wrong because they only count labor savings, which captures about 30% of the actual return. The full picture, which includes five components—labor savings, error reduction, speed-to-revenue, opportunity cost recovery, and scale capacity—captures approximately 70% more value than labor savings alone.
The core formula looks like this:
Annual ROI = (Hours saved per week × loaded hourly cost × 52) + recovered revenue + error reduction savings − total automation cost
Payback period = total first-year cost ÷ (annual savings ÷ 12)
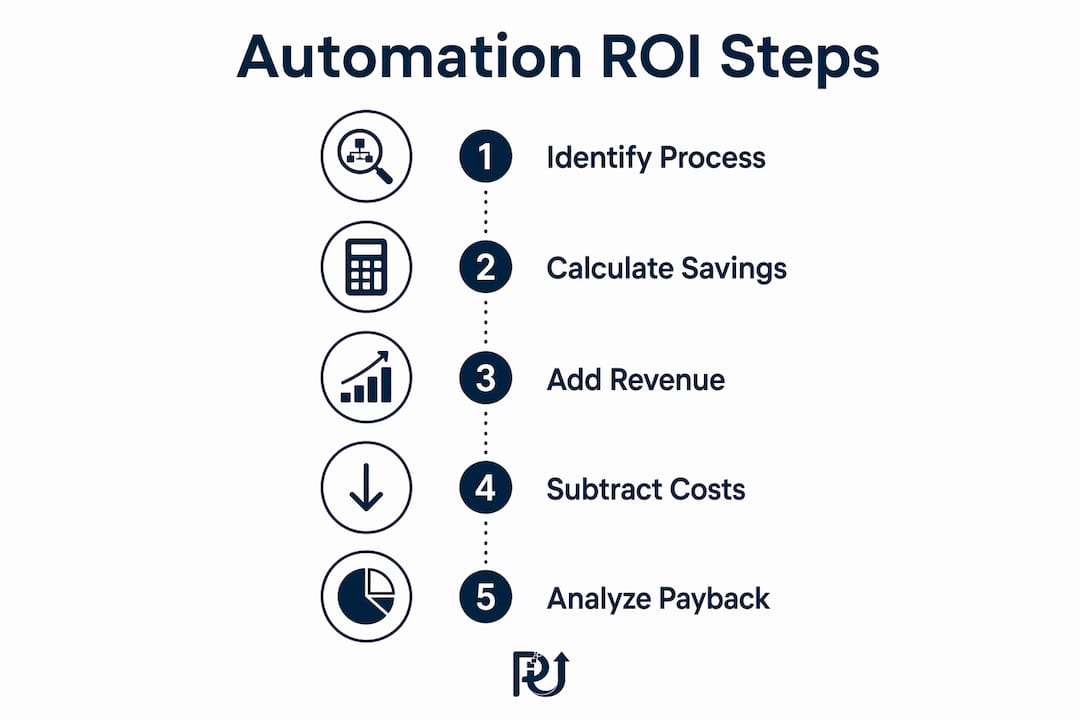
To build an honest calculation, work through these steps:
-
Map actual process time. Track a full week, including interruptions and tool switching, not just the core task.
-
Estimate labor savings. Multiply weekly hours saved by the fully loaded hourly rate, then annualize.
-
Add error reduction savings. Calculate errors per month, multiply by cost per error, then multiply by 12.
-
Factor in speed-to-revenue. Estimate leads or transactions lost to slow response times and assign a dollar value.
-
Recover opportunity cost. Price the hours freed from manual work at the value of what those people could do instead.
-
Quantify scale capacity. Estimate the revenue from additional volume you can now handle without adding headcount.
-
Subtract total costs. Include build costs, licensing, maintenance, and any installation or auxiliary hardware.
The payback period matters as much as the ROI percentage. Most small business automation projects pay for themselves within 60 to 120 days, with an average 200% ROI in year one according to Forrester’s 2024 study.
Pro Tip: Before you build a business case, run the five-component calculation on a single process first. A narrow, well-measured pilot is far more persuasive to a CFO than a broad estimate covering your entire operation.
What factors drive your automation investment returns?
The size of your return depends heavily on which process you automate and how you measure the outcome. Not all automation projects are equal, and the dominant ROI driver shifts by use case.
-
Labor savings come from hours eliminated on repetitive tasks. Multiply weekly hours saved by the fully loaded cost per hour (salary plus benefits plus overhead), then annualize. A team with a significant portion of their time spent on manual data tasks represents multiple full-time equivalents locked in work a system could handle.
-
Error reduction compounds over time. Transposed invoice numbers, missed follow-ups, and bad data entries all carry real costs in rework, refunds, and compliance exposure. Consistent automation reduces the variability that drives those costs.
-
Speed-to-revenue is the component most teams skip entirely. Responding to a lead quickly significantly increases the likelihood of connection compared to longer wait times, according to recent Harvard Business Review research. For customer-facing processes, this single factor often dominates the total return.
-
Opportunity cost recovery means pricing what your skilled people could do if they weren’t buried in admin. A founder spending 15 hours a week on data entry isn’t just losing $22 per hour in labor. The real cost is the revenue from the strategic work that never gets done.
-
Scale capacity lets you grow revenue without growing headcount. If your team currently handles 50 clients and automation lets them handle 150 with the same people, clients 51 through 150 represent pure growth.
Industry and process type shift which of these factors dominates. In industrial manufacturing, error reduction and throughput tend to lead. In professional services, opportunity cost recovery and speed-to-revenue usually carry the most weight. Automation’s impact on B2B marketing follows a similar pattern, where faster lead response and consistent follow-up often generate more value than the direct labor savings.
Common mistakes that distort your ROI measurement
The most expensive mistake in automation ROI is underestimating how long the manual process actually takes. A 2023 McKinsey analysis found that teams underestimate manual process time by 30–50% because they only count the core task and ignore the overhead: the tool switching, the interruptions, the exception handling. That gap directly inflates your projected savings and sets up a credibility problem when actuals come in lower.
Other common gaps:
-
Counting only labor savings. As noted earlier, labor alone captures about 30% of the real return. Teams that stop there systematically undervalue their projects and struggle to justify larger investments.
-
Ignoring speed-to-revenue. For any customer-facing process, slow response is a revenue leak. Automation that cuts response time from hours to minutes doesn’t just save labor. It recovers deals that were already walking out the door.
-
Skipping adoption quality. Automation systems built well but used inconsistently fail to deliver ROI. If half your team bypasses the automated workflow, you’re paying for full capacity and getting partial results.
-
Missing hidden costs in industrial automation. Robot hardware is only about one-third of total system cost. Installation, auxiliary hardware, backup power, and mounting can double or triple the purchase price. An ROI model built on hardware cost alone will be wrong by a wide margin.
-
Ignoring opportunity cost entirely. This is the hardest component to quantify and the one most likely to be the largest. Skipping it produces a conservative estimate that undersells the investment.
Pro Tip: Track actual workflow usage data for 30 days after go-live. Compare observed time savings against your pre-launch estimates. The gap tells you exactly where your ROI model needs adjustment, and it gives you the evidence to course-correct before the quarterly review.
How to maximize Automation ROI over time
The biggest lever for improving returns isn’t the technology. It’s adoption. Uneven ROI almost always traces back to gaps in training, role modeling, or workflow alignment, not to a technology gap.
Practical tactics that move the needle:
-
Anchor automation to high-volume, specific workflows. Agents or automations tied to a named, repetitive Tier-1 task show a clear return faster than broad productivity tools with no defined scope.
-
Make structured, role-based training a prerequisite. Train managers first so they can model the behavior for their teams. Visible executive usage is the single strongest accelerator of routine adoption across an organization.
-
Measure workflow, user, and business KPIs together. Cycle time and backlog reduction tell you the workflow is faster. Adoption rate and hours saved tell you people are actually using it. Conversion rates and compliance scores tell you the business is getting better. You need all three groups.
-
Run an expansion rhythm. Treat automation as recurring quarterly work. Pick a new high-volume workflow, build or configure the automation, measure against baseline for 90 days, review with a sponsor, and decide whether to scale or retire it.
-
Track leading indicators, not just outcomes. Leading organizations measure 30-day adoption rates and early quality signals alongside lagging financial results. That way, a miss becomes visible early enough to fix.
-
Build for AI’s learning curve. Unlike fixed human labor costs, AI-driven automation systems tend to improve their performance as they process more volume. ROI models that treat AI agent performance as static will underestimate long-term returns.
For service businesses specifically, the combination of faster response, consistent follow-up, and freed capacity for client work tends to compound quickly once adoption reaches a critical threshold.

Measuring automation benefits beyond labor savings
Labor savings are the easiest component to quantify, which is exactly why they dominate most ROI conversations. The components that are harder to measure often generate more value.
| ROI component | What to measure | Typical annual range |
|---|---|---|
| Labor savings | Hours saved × hourly rate × 52 | $5,000–$50,000 |
| Error reduction | Errors per month × cost per error × 12 | $2,000–$20,000 |
| Speed-to-revenue | Lost leads recovered × average deal value | $10,000–$200,000 |
| Opportunity cost | Hours freed × value of redirected work | Varies; often the largest |
| Scale capacity | Added volume × revenue per unit | Depends on business model |
Source: Builts AI automation ROI framework
A real-world example makes the scale concrete. A customer-service automation handling 10,000 sessions per month, where 5,000 sessions cite knowledge sources and 3,000 of the remaining sessions resolve successfully, generates roughly $1.24 million per year by returning 1,440 representative hours monthly at a $72 fully loaded hourly rate. The labor savings alone would have told a fraction of that story.
Strategic value drivers like decision velocity, employee confidence, and organizational resilience require different measurement tools. These are leading indicators: employee sentiment on AI adoption, number of redesigned workflows in flight, and new capabilities shipped. They don’t show up on a cost-savings spreadsheet, but organizations that track them alongside financial metrics consistently realize stronger results over time.
The discipline of measuring outcomes across workflow, user, and business KPI groups transforms automation ROI from an anecdote into an investment thesis. That shift matters when you’re asking for budget to scale.
Which tools help you calculate and track automation ROI?
Several purpose-built tools and frameworks exist for calculating and tracking automation returns, each suited to a different context.

ROI calculators and modeling tools:
The A3 ROI Robot System Value Calculator from the Association for Advancing Automation compares manual labor costs against total robotic system ownership over a 20-year lifespan. It accounts for system purchase price, annual maintenance at 5%, electricity costs, and workforce scale. For industrial automation projects, this is a solid starting point for stakeholder presentations.
Microsoft Copilot Studio includes a built-in Savings Calculator and an Agent Assisted Value card within its agents report, pulling from U.S. Bureau of Labor Statistics data for default hourly rates. It’s designed for enterprise AI agent deployments and produces the kind of documented, auditable ROI chain that finance teams accept.
KPI tracking and dashboards:
For smaller teams, a structured spreadsheet in Google Sheets or Notion works well when built around three metric categories: direct metrics (hours saved, error rate, response time), revenue metrics (lead conversion, churn, days to payment), and capacity metrics (clients per employee, high-value versus admin work ratio). Review it on the first week of each month.
Enterprise teams benefit from platforms that surface workflow KPIs like cycle time and backlog alongside user adoption data and business outcome metrics. The goal is a single view that connects automation activity to financial results, not three separate reports that no one reconciles.
Pro Tip: Whatever tool you use, build your ROI model before you deploy, not after. A pre-deployment baseline is the only way to produce a credible before-and-after comparison. Post-hoc estimates are easy to challenge.
Short-term vs. long-term ROI: how the timeline changes your analysis
Short-term and long-term automation ROI require different measurement frameworks, and conflating them is a common source of disappointment.
In the short term, the clearest wins come from high-volume, rule-based processes with obvious labor costs. Invoice processing, lead routing, password resets, and appointment scheduling all tend to pay back quickly. Forrester’s 2024 Total Economic Impact studies report an average 200% ROI in year one for business process automation, and 73% of organizations in Deloitte’s 2023 Global Intelligent Automation Survey hit positive ROI within 12 months. Simple single-process automations often break even in under 30 days.
Long-term ROI tells a different story. The compounding effects of error reduction, scale capacity, and strategic value take 12–36 months to fully materialize. AI-driven systems improve as they process more data, so a model that treats performance as static will underestimate three-year returns. The AI automation cost breakdown shifts favorably over time as per-transaction costs drop while human labor costs continue to rise.
For industrial automation, the timeline extends further. A $50,000 robot with a total system cost of $150,000 (hardware multiplied by three to account for installation and auxiliary equipment) generating $225,000 in annual labor savings produces $75,000 net in year one and full payback by year two. But the 20-year system life means the real return dwarfs the first-year figure. Short-term ROI analysis applied to long-lived capital equipment systematically undervalues the investment.
The practical implication: use short-term ROI to select your first projects and build organizational confidence. Use long-term ROI modeling to justify infrastructure-level investments and set executive expectations correctly.
How automation ROI benchmarks vary by industry
Automation ROI benchmarks differ significantly across sectors, and using the wrong reference point can lead to either over-promising or under-investing.
Manufacturing and industrial operations tend to show the most predictable returns because the inputs are measurable: cycle time, defect rate, throughput per shift. Processes can run 20–110% faster with robotic integration, and the savings compound across multi-shift operations. The challenge is that total system cost often runs three to five times the hardware price once installation and auxiliary equipment are included.
Professional services and knowledge work see their largest returns from opportunity cost recovery and speed-to-revenue. A firm that automates client onboarding, contract review, or proposal generation frees senior staff for billable work. The dollar value of that freed time typically exceeds direct labor savings by a wide margin.
Customer-facing operations (sales, support, service) are where speed-to-revenue dominates. The 100x connection-likelihood improvement from five-minute versus 30-minute lead response applies directly here. Service consistency at scale also drives measurable retention improvements that show up in churn metrics 6–12 months after deployment.
IT and enterprise workflows benchmark against metrics like mean time to repair (MTTR), cost per ticket, and deflection rate. Vodafone reported saving four hours per person per week through AI-assisted contract review, a figure that combines time reclaimed with workflow quality improvement.
The honest benchmark for any sector is your own pre-automation baseline. External figures from vendors or industry surveys are useful for pressure-testing your expectations, not for replacing your own measurement.
POWITUP builds automation that pays for itself
Most automation projects stall not because the technology fails, but because the ROI model was too narrow and adoption was treated as an afterthought. POWITUP takes a different approach.
POWITUP designs and deploys custom AI agents built around your highest-volume workflows, the ones where labor costs, error rates, and slow response times are actively costing you money. Rather than generic integrations, POWITUP functions as a technical architect: mapping your actual process costs, identifying the five ROI components that apply to your operation, and building systems that generate a measurable return from day one. The result is a digital workforce that scales your processing capacity without a corresponding increase in headcount.
If you’re ready to move from ROI estimates to real numbers, explore POWITUP’s AI automation services or review the AI integration options built for business leaders who need defensible results, not vendor projections.
FAQ
What is automation ROI?
Automation ROI is the net financial return from an automation investment, calculated as total savings (labor, error reduction, recovered revenue, and scale capacity) minus total automation cost, divided by that cost. It measures whether the investment pays off and by how much.
What is the formula for ROI in automation?
The standard formula is: Annual ROI = (hours saved per week × loaded hourly cost × 52) + recovered revenue + error reduction savings, minus total automation cost. Divide first-year cost by monthly savings to find your payback period in months.
What does a 200% automation ROI mean?
A 200% ROI means you received $3 in total value for every $1 invested, netting $2 above your cost. Forrester’s 2024 Total Economic Impact studies report this as the average for business process automation in year one.
Is a 2% ROI good for automation?
No. A 2% ROI on an automation project indicates the investment is barely breaking even and likely means key value components like speed-to-revenue or opportunity cost were excluded from the calculation. Most well-scoped automation projects return well above 100% in year one.
How long does it take to see positive automation ROI?
Most small business automation projects pay for themselves within 60 to 120 days, with an average 200% ROI in year one according to Forrester’s 2024 study.
Key Takeaways
Automation ROI requires measuring all five value components, not just labor savings, to produce a calculation that holds up under scrutiny.
| Point | Details |
|---|---|
| Five-component ROI model | Labor savings alone captures about 30% of the actual return; the full five-component model captures roughly 70% more value than labor savings alone, including error reduction, speed-to-revenue, opportunity cost, and scale capacity. |
| Typical payback timeline | Most small business automation projects pay for themselves within 60–120 days, with an average 200% ROI in year one, based on Forrester’s 2024 study. |
| Process time underestimation | Teams commonly underestimate manual process time due to ignoring interruptions and tool switching, according to a 2023 McKinsey analysis. |
| Adoption drives outcomes | Automation built well but used inconsistently fails to deliver ROI; tracking adoption KPIs is as important as tracking cost savings. |
| POWITUP’s approach | POWITUP designs AI agents anchored to high-volume workflows, measuring all five ROI components to produce defensible, scalable returns. |