
Operational intelligence turns streaming data from your systems, sensors, and transactions into decisions you can act on within seconds or minutes, not days. It works by watching activity as it happens and either alerting a human or triggering an automated fix before a small problem becomes an outage. IT teams, plant managers, and operations leaders use it to cut downtime, shrink response times, and stop losses while they’re still small.
TL;DR:
- Most organizations should focus on a single high-impact KPI during initial OI pilots to ensure manageable tuning and clear proof of value.
- Data quality, latency, and integration issues are the primary risks that can undermine trust and effectiveness in operational intelligence systems.
- OI dashboards are most effective when designed with alert-first visuals like gauges, heat maps, and topology charts that enable rapid, at-a-glance decision-making.
- Automating remediation based on OI alerts requires careful governance, role-based access control, and logged action trails to mitigate security and compliance risks.
- Investing in scalable cloud analytics infrastructure before AI layers enhances overall system reliability and long-term value realization.
Table of Contents
- What Is Operational Intelligence, and How Does It Differ From BI?
- How Does Operational Intelligence Work in Practice?
- What Technologies Power Operational Intelligence?
- What Business Benefits Does Operational Intelligence Deliver?
- Where Does Operational Intelligence Deliver Real Value?
- How Do You Get Started Implementing Operational Intelligence?
- What Are the Biggest Risks and Challenges With Operational Intelligence?
- How Should OI Integrate With Existing BI and Analytics Systems?
- What Real-Time Visualization Techniques Work Best for OI?
- What Security and Privacy Risks Come With Operational Intelligence?
- How Do You Choose the Right OI Vendor or Tool?
- What’s Next for Operational Intelligence?
- How AI Automation Complements Operational Intelligence
- Ready to Turn Operational Data Into Automated Action?
- Sources
- FAQ
What Is Operational Intelligence, and How Does It Differ From BI?
Operational intelligence (OI) is real-time, activity-centric analytics. It runs queries against data in motion, streaming logs, sensor readings, transaction feeds, and turns the results into immediate operational instructions rather than after-the-fact reports. The output isn’t a quarterly chart. It’s a dashboard flashing red, an alert on someone’s phone, or a system that automatically restarts a failing service.
Business intelligence (BI) asks a different question. BI aggregates historical data, usually pulled from a data warehouse on a daily or weekly cycle, to answer strategic questions: which product line is most profitable, which region underperformed last quarter, where should next year’s budget go. OI asks: is something breaking right now, and what do we do about it in the next five minutes?
The practical differences come down to three things:
- Timeliness: OI operates on seconds-to-minutes latency; BI operates on hours-to-months.
- Actionability: OI outputs are often instructions (isolate this server, reroute this order); BI outputs are usually insights for planning.
- Audience: OI serves front-line operators and on-call engineers; BI serves executives and analysts.
Most mature organizations run both side by side. OI and BI are complementary. OI handles the real-time operational choice, and BI handles the longer strategic view built from the same underlying data.
How Does Operational Intelligence Work in Practice?
The pipeline behind OI follows a consistent pattern, whether you’re monitoring a data center or a factory floor. Understanding the flow matters more than memorizing the vocabulary.
- Collection: Data streams in from application logs, infrastructure metrics, business events, IoT sensors, and transaction records. Volume and velocity are usually high, and the data arrives continuously rather than in batches.
- Processing: Streaming analytics engines and complex event processing (CEP) tools filter, enrich, and correlate events in real time, looking for patterns across multiple feeds at once rather than examining one log line in isolation.
- Analysis: This is where OI climbs what’s often called the analytics ladder. Descriptive analytics tells you what’s happening now. Diagnostic analytics tells you why. Predictive analytics flags what’s likely to happen next. Prescriptive analytics recommends, or automatically executes, the response.
- Action: The results surface as live dashboards, real-time alerts routed to the right person, or automated remediation, such as auto-scaling a server cluster or shutting down a faulty valve.
Operational intelligence provides continuous analytics on data in motion and at rest, which is the structural reason it can support dashboards, alerts, and automated remediation in the same system rather than requiring separate tools for each.
Pro Tip: Map your data sources before you touch a tool. Most failed OI pilots don’t fail because the software is weak. They fail because nobody audited latency and quality on the incoming feeds first, so the “real-time” dashboard ends up displaying stale or incomplete numbers.
Modern OI stacks lean heavily on streaming analytics, CEP, AI/ML, and orchestration working together so the system can detect an anomaly and trigger a guided or automatic fix without waiting for a human to notice the dashboard first.
What Technologies Power Operational Intelligence?
A working OI stack is really a handful of specialized components stitched together, not one product you buy off a shelf.
- CEP and stream-processing engines correlate events across multiple sources in real time, catching patterns a single log file would never reveal on its own.
- Business Activity Monitoring (BAM) layers sit on top of process data to track whether a business transaction, like an order or a claim, is moving within its expected time window.
- Time-series databases and log/metric collectors store the high-volume, timestamped data OI depends on, optimized for fast writes and fast range queries.
- IoT and IIoT sensors feed telemetry from physical equipment, temperature, vibration, pressure, straight into the analytics layer, often with edge collection to cut latency before data ever reaches the cloud.
- AI and machine learning models handle anomaly detection and, increasingly, prescriptive recommendations. AI and ML push OI beyond simple alerting into prediction and prescription, which is what allows a system to suggest, or take, the next best action instead of just flagging a problem.
- Orchestration and automation tools carry out the remediation itself, restarting services, rerouting traffic, or opening a ticket with the right context already attached.
If you’re weighing where to invest first, cloud analytics services built around scalable data pipelines tend to pay off before you add heavier AI layers, since a shaky ingestion pipeline undermines every model downstream of it.
What Business Benefits Does Operational Intelligence Deliver?
The return on OI shows up in fewer bad surprises and faster recovery from the ones you can’t avoid. Splunk’s guidance on OI features points to a consistent feature set behind these gains: live dashboards, real-time alerting, automatic remediation, and customizable views for front-line staff.
The measurable outcomes tend to cluster around a few KPIs worth tracking from day one:
- Mean time to detect (MTTD) and mean time to resolve (MTTR), the two clearest signals that OI is shortening your decision loop.
- Incidents per month, which should trend down as automated detection catches issues before they escalate.
- Percentage of remediations handled automatically, a direct measure of how much manual firefighting you’ve eliminated.
- SLA compliance rate, since faster detection usually shows up first as fewer breached service agreements.
For a rough pilot ROI estimate, multiply your current average incident cost by the number of incidents you expect OI to catch earlier or prevent outright, then compare that against implementation cost over a single quarter. Splunk’s own framework for getting started with OI recommends proving this on one KPI before expanding scope, and a data-driven operations playbook can help structure that first measurement window.
Where Does Operational Intelligence Deliver Real Value?
OI shows up differently depending on the floor you’re standing on, but the pattern, watch, detect, act, repeats everywhere.
- IT operations and observability: engineering teams use OI to catch a memory leak or a failing microservice before it takes down a customer-facing app, often triggering an automatic rollback or scale-up before an on-call engineer even opens their laptop.
- Manufacturing and IIoT: sensor data from factory equipment feeds predictive maintenance models that flag a bearing likely to fail next week, and quality-control systems that catch a defect trend across a production run in real time. Adoption here is well documented, with OI applications spanning IT operations, manufacturing, retail, and finance for exactly this kind of monitoring.
- Customer service: contact centers route incoming chats or calls in real time based on live agent availability and issue complexity, enforcing SLAs automatically instead of discovering a breach in next week’s report.
- Finance and e-commerce: transaction monitoring systems flag a fraud pattern mid-transaction, not after the chargeback arrives, and OI dashboards catch checkout failures spiking during a flash sale before revenue takes a real hit.
Each of these scenarios shares the same underlying shape: a stream of events, a threshold or pattern worth watching, and a response fast enough to matter. A deeper look at operational automation case studies shows how these patterns play out with real KPI movement across different team structures.
How Do You Get Started Implementing Operational Intelligence?
Skip the temptation to buy a platform first and figure out the use case later. That order produces expensive dashboards nobody trusts.
- Audit your data sources. Catalog every log, metric, sensor feed, and transaction stream you have, then check quality, completeness, and latency. A feed that updates every fifteen minutes isn’t real time, no matter what the vendor calls it.
- Pick one KPI and one use case. Resist the urge to monitor everything at once. Choose the metric with the clearest business cost, like MTTR on a specific service, and define a measurement window before you start.
- Assemble a cross-functional team. You need someone who owns the data, someone who owns the business process, and someone who owns governance and access control, ideally in the same room from week one.
- Choose integration points and automation targets. Decide upfront which alerts stay human-reviewed and which get automated remediation, and document the difference clearly for everyone on the team.
- Run a time-boxed pilot. Splunk’s guidance recommends starting with a single KPI and a defined pilot window before scaling, which limits both cost and alert fatigue while you’re still tuning thresholds.
- Measure, tune, and expand. Review pilot results against your baseline, adjust alert thresholds that fired too often or too rarely, then widen scope to a second use case.
Pro Tip: Treat your first pilot’s alert thresholds as a draft, not a decision. Almost every team sets them too sensitive in week one, drowns in noise, then has to recalibrate. Budget time for that recalibration instead of treating it as a failure.
Teams looking for structured support on the data-readiness step often lean on data analytics services to get the underlying pipeline solid before layering real-time logic on top.
What Are the Biggest Risks and Challenges With Operational Intelligence?
The technology rarely fails first. Governance and process usually do.
- Data quality and integration complexity top the list. Feeding an OI system inconsistent or incomplete data produces alerts nobody trusts, and trust, once lost, is hard to rebuild.
- Alert fatigue kills more OI programs than any technical limitation. Poorly tuned thresholds flood operators with noise until they start ignoring the dashboard entirely.
- Access control and governance matter more than most teams expect going in. Unrestricted dashboards can expose confidential operational metadata to people who shouldn’t see it, a real risk once sensitive transaction or customer data flows through a live system.
- Skill gaps slow adoption, since running CEP tools and tuning streaming pipelines requires different expertise than traditional BI reporting.
Mitigate these with a phased rollout, written playbooks for common alert types, and automation guardrails that require human approval for high-impact actions until the system earns trust.
How Should OI Integrate With Existing BI and Analytics Systems?
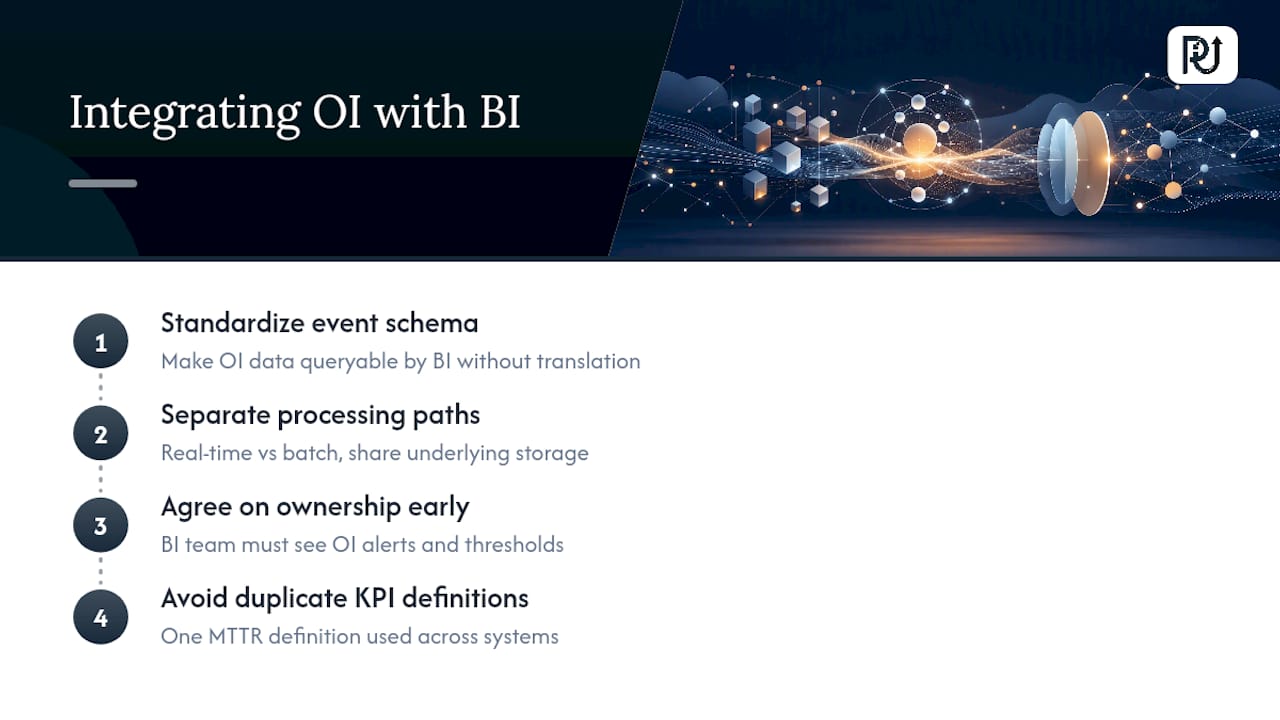
The mistake most organizations make is treating OI and BI as competing systems instead of a layered pair. OI should feed the same data warehouse your BI tools already pull from, not build a parallel, disconnected data silo that analysts have to reconcile manually every quarter.
Start by standardizing your event schema so operational data lands in a format your BI team can query without translation work. If your OI system tags an incident with a timestamp, severity, and affected service, that same structure should flow into your historical reporting layer, so a quarterly review of downtime trends doesn’t require rebuilding the dataset from scratch.
Second, separate your real-time and batch processing paths clearly, but let them share underlying storage where possible. Time-series databases built for OI can often feed nightly extracts into the same warehouse BI dashboards already query, cutting duplicate infrastructure.
Third, agree on ownership early. Whoever manages the BI stack should have visibility into what OI alerts and thresholds actually mean, since a spike an OI system treats as noise might be exactly the signal a strategic BI report needs to explain a quarterly anomaly. Cross-training a few analysts on both systems closes this gap faster than any documentation.
Finally, resist duplicating KPIs across both systems with different definitions. If MTTR means one thing in your OI dashboard and something slightly different in a quarterly BI report, leadership loses confidence in both.
What Real-Time Visualization Techniques Work Best for OI?
A dashboard that updates every few seconds is only useful if a human can actually parse it under pressure, which rules out most standard BI chart types.
Live tiles and single-metric gauges work better than dense multi-series line charts for OI, because an operator scanning a wall of screens during an incident needs a red, yellow, or green signal at a glance, not a trend line to interpret. Heat maps work well for spotting anomalies across many similar systems at once, like server nodes or factory sensors, since a color shift catches the eye faster than a number buried in a table.
Time-series charts still matter, but keep the window short, minutes or hours, not months, and layer a threshold line directly on the chart so deviation is visible without a legend. Topology maps, showing how services or machines connect, help operators trace a failure’s blast radius immediately rather than guessing which downstream system will break next.
Alert-first design beats chart-first design in OI. The dashboard’s job is to surface the three things that need attention right now, not display everything available. Splunk’s feature guidance backs this up directly: live dashboards, real-time alerting, and customizable views for front-line users consistently rank as the features operators actually rely on, ahead of deeper analytical views built for after-the-fact review.
What Security and Privacy Risks Come With Operational Intelligence?
OI systems concentrate a lot of sensitive telemetry in one place, which makes them an attractive target and a genuine governance headache if access controls lag behind adoption.
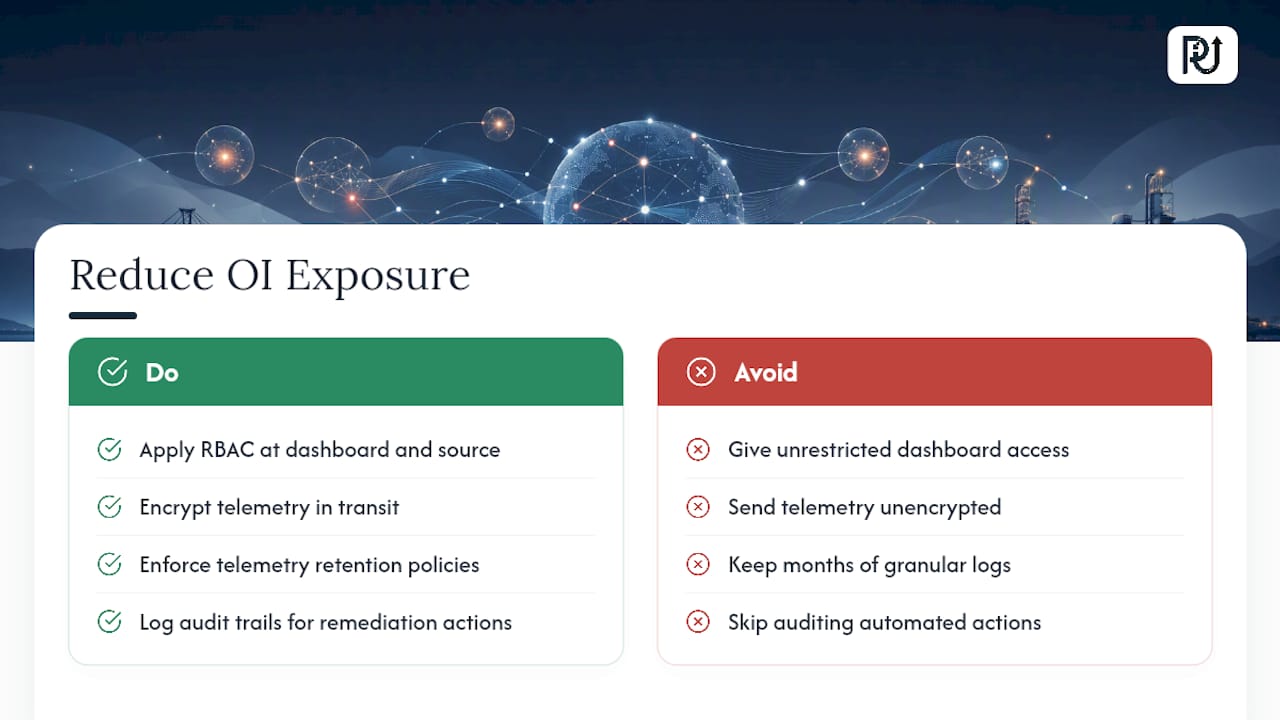
Operational data often includes information that looks harmless in isolation, a server hostname, a transaction ID, a sensor reading, but becomes sensitive once correlated at scale. A dashboard showing live transaction volume by region can leak competitive business information if the wrong person has view access. AWS’s guidance on OI flags data governance and access control as central challenges, specifically warning that unrestricted dashboards risk exposing confidential operational metadata without proper controls.
Three practices reduce exposure meaningfully. First, apply role-based access control at the dashboard and data-source level, not just at the application layer, so a customer service lead sees service-level metrics without also seeing raw transaction details. Second, encrypt data in transit between edge sensors or application logs and your processing layer, since IoT and IIoT telemetry frequently travels over networks that weren’t designed with sensitive payloads in mind. Third, build data retention policies specific to operational telemetry, since streaming systems can quietly accumulate months of granular logs that create compliance exposure nobody planned for.
Audit trails matter here too. Every automated remediation action, especially one that touches customer data or financial transactions, needs a logged record of what triggered it and what it changed, both for compliance and for debugging when automation gets it wrong.
How Do You Choose the Right OI Vendor or Tool?
The open source versus proprietary decision usually comes down to how much engineering capacity you have on staff, not which option is objectively better.
Open source stream-processing and CEP frameworks give you full control over architecture and no licensing cost, but they demand in-house expertise to deploy, tune, and maintain at scale. Teams with strong platform engineering already in place often prefer this route because it avoids vendor lock-in and lets them customize processing logic precisely to their data shapes.
Proprietary platforms trade some of that flexibility for faster time-to-value. Vendor-supported OI tools typically ship with prebuilt dashboards, alerting logic, and integrations that would otherwise take months to build in-house, which matters most for teams that need results in one quarter rather than one year.
A few criteria matter regardless of which path you pick. Check how well a tool handles your actual data volume and velocity under load, not just its marketing benchmarks. Confirm it integrates cleanly with your existing log, metric, and event sources without requiring a rebuild of your data pipeline. Look closely at how remediation actions are configured and audited, since that’s where governance risk concentrates. And weigh total cost honestly: open source tools aren’t free once you count the engineering hours needed to keep them running reliably at scale.
What’s Next for Operational Intelligence?
Edge computing is pulling more of the analysis closer to where data originates. Instead of shipping every sensor reading to a central cloud for processing, edge devices increasingly run lightweight anomaly detection locally, cutting the latency between an event happening and a response triggering, which matters most in industrial settings where a few seconds of delay has physical consequences.
AI integration is deepening past simple anomaly detection into genuinely prescriptive systems. Rather than flagging that a server is behaving abnormally, next-generation OI platforms increasingly recommend, or directly execute, the specific fix based on patterns learned from thousands of similar past incidents. That shift from detection to prescription is the biggest structural change happening in the space right now.
Expect tighter convergence between OI and broader automation platforms too, where the line between “monitoring system” and “autonomous operations system” continues to blur. The organizations getting ahead of this aren’t just watching dashboards more closely. They’re building the automated response layer that acts on what those dashboards see, often faster than a human operator could react in the first place.
How AI Automation Complements Operational Intelligence
Operational intelligence tells you something needs action. AI agents can take that action at scale, handling the remediation, document review, or transaction processing an OI system flags without waiting on manual queues. This layer is built directly by a company offering productized tools for document validation and portfolio health monitoring. Readers exploring implementation can review POW IT UP’s AI integration services for more detail.
— Syed Naveed Abbas
Ready to Turn Operational Data Into Automated Action?
Operational intelligence gets you the alert. What happens next is where most teams still fall back on manual work, someone reviewing a document, reassigning a task, or chasing a fix by hand. This gap can be closed by building custom AI agents and an automation layer that act on what OI dashboards catch, allowing teams to scale response volume without scaling headcount.
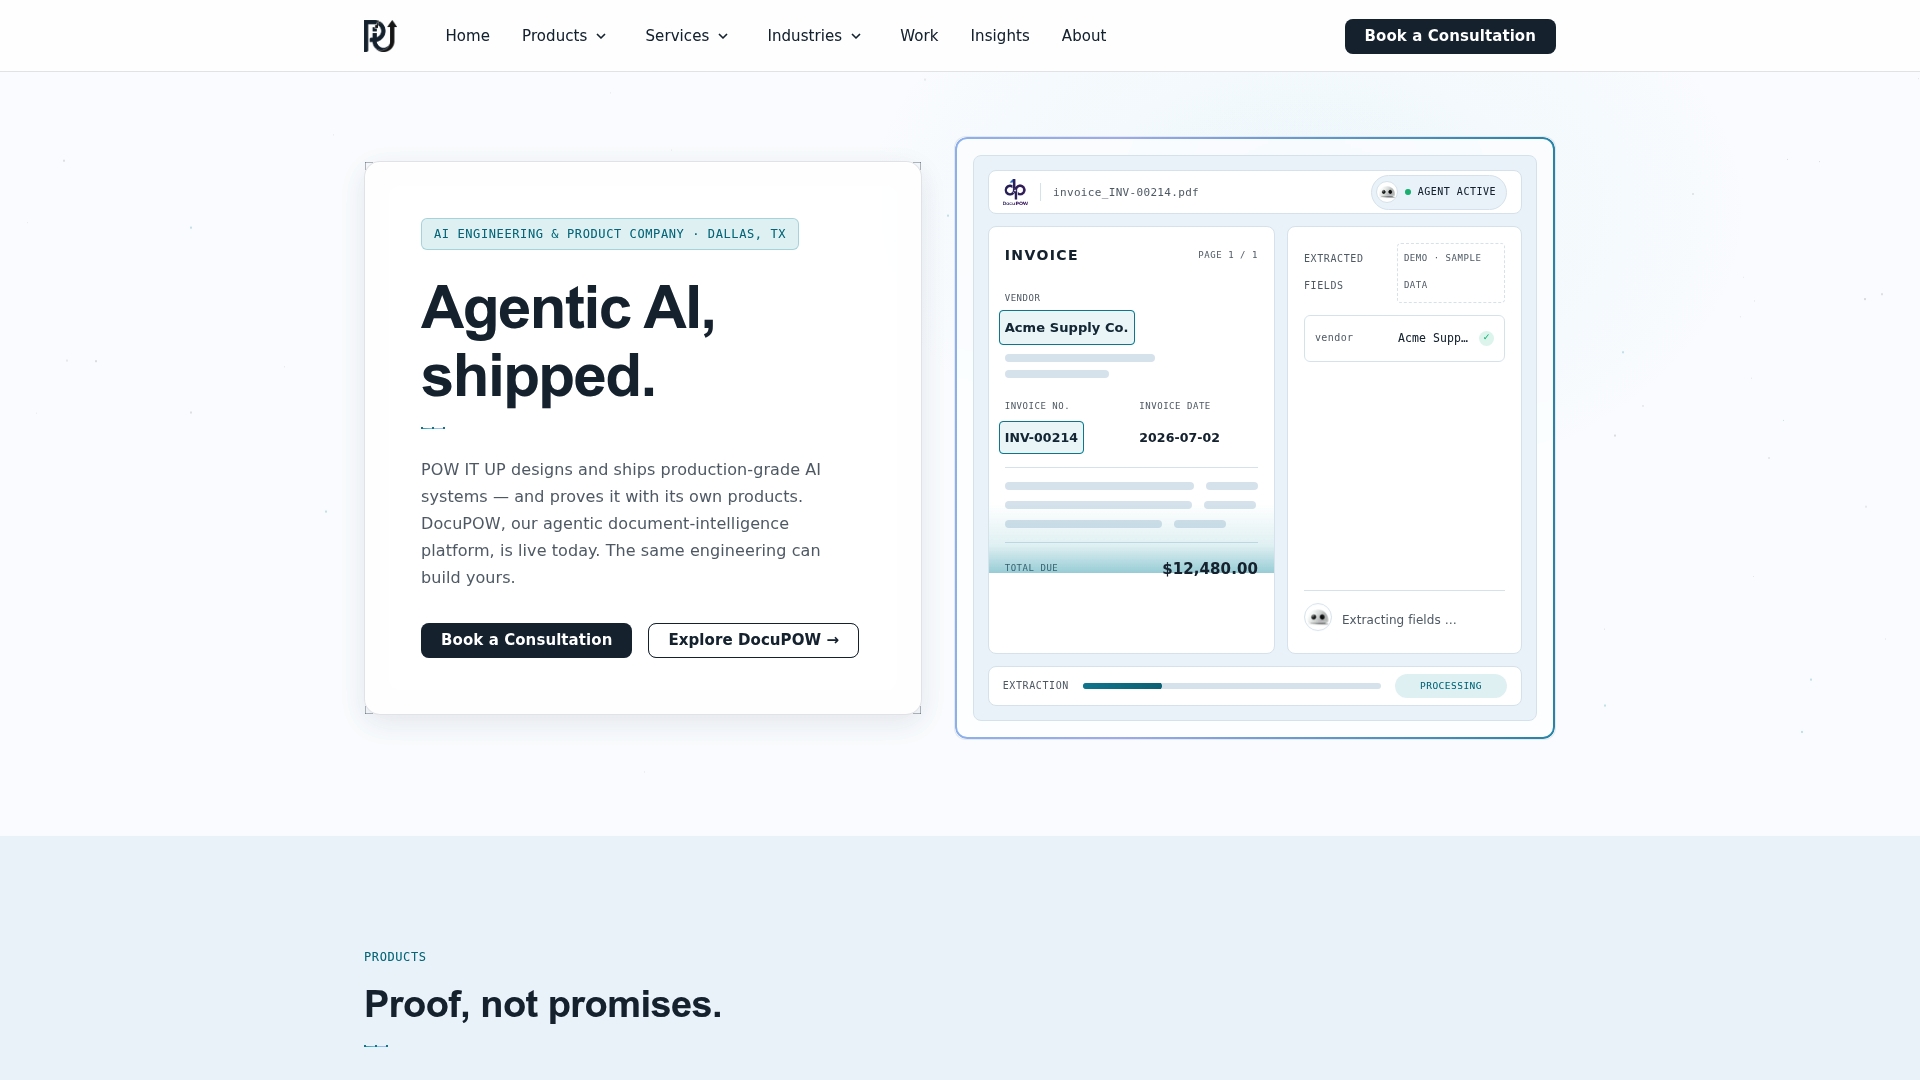
Whether you need document intelligence that validates transactions the moment an anomaly fires, or workflow orchestration that routes an alert straight to the right automated fix, such systems can be designed around your existing data, not a generic template. Businesses in industries such as fintech, manufacturing, logistics, and healthcare use this approach to convert real-time signals into remediation without adding staff. If your OI pilot keeps surfacing the same manual bottleneck, explore POW IT UP’s AI automation services and request a consultation to see how the fix gets built.
Sources
For deeper technical framing, see Gartner’s analyst coverage, AWS’s OI overview, Splunk’s implementation guidance, and IBM’s data-driven decision-making primer.
- What is Operational Intelligence (OI)? – AWS
- Operational Intelligence: 6 Steps To Get Started | Splunk
FAQ
What Is the Difference Between Tactical and Operational Intelligence?
Tactical intelligence generally refers to short-term, situational decision support in fields like military or security operations, focused on immediate, localized actions. Operational intelligence in the business and IT sense refers to real-time analytics on streaming data, logs, sensors, transactions, that drive immediate operational decisions and automated remediation.
What Are Some Examples of Operational Intelligence?
Common examples include IT teams catching a failing server before it causes an outage, factory sensors predicting equipment failure before it happens, and fraud detection systems flagging suspicious transactions in real time. Customer service platforms that route calls based on live agent availability are another everyday example.
What Does Operational Intelligence Mean in a Military Context?
In military and defense contexts, operational intelligence typically refers to intelligence gathered and analyzed to support decisions at the operational level of command, distinct from tactical (battlefield) or strategic (long-term policy) intelligence. This differs from the business and IT usage of the term, which centers on real-time data analytics for organizational operations.
What Is Meant by “Operational IQ”?
“Operational IQ” isn’t a standardized industry term with one fixed definition. In practice, people generally use it to describe how effectively an organization turns real-time operational data into fast, accurate decisions, which is functionally what operational intelligence platforms are built to improve.
How Long Does an Operational Intelligence Pilot Usually Take?
Most practical guidance recommends a time-boxed pilot centered on a single KPI, often a matter of weeks rather than months, before expanding scope to additional use cases. Starting narrow keeps alert tuning manageable and produces a clear proof of value before wider rollout.