

Growth through technology is the deliberate use of data, automation, and converging digital capabilities to expand revenue, margins, and market reach — and the leaders who treat it as a strategic discipline, not a cost line, consistently outpace those who don’t. Research from multiple think tanks and industry analysts indicates that firms combining AI, cloud infrastructure, and process automation in an integrated way tend to compound their advantages faster than those chasing isolated breakthroughs.
Three things to do right now:
- Start with data and cloud infrastructure — without a clean, unified data layer, every AI or automation initiative hits a ceiling fast.
- Run a converged pilot — pair AI with automation on one high-volume transactional process and measure cycle time and error rate within 90 days.
- Set KPIs before you build — define revenue per customer, cost-per-transaction, and adoption rate targets upfront so every investment ties to an outcome.
Key Takeaways
Technology-driven growth compounds when leaders combine AI, automation, and cloud infrastructure in integrated systems rather than deploying isolated tools.
| Point | Details |
|---|---|
| Start with data and cloud | A clean, unified data layer is the prerequisite for every AI and automation initiative that scales. |
| Apply the 3Cs framework | Combine, converge, and compound technologies to create step-change advantages, not incremental gains. |
| Run a 90-day scoped pilot | Define scope, data access, success metrics, and governance before building — narrow pilots scale better. |
| Measure by stakeholder | CEOs track ARR and margin; COOs track cycle time and error rate; econ-dev directors track firm adoption and investment attracted. |
| POW IT UP for execution | POW IT UP builds custom AI agents and automation systems that follow the pilot-to-scale model with agreed KPIs. |
Table of Contents
- How does technology actually drive business growth?
- Which technologies should you prioritize right now?
- Why convergence is the real engine of modern growth
- What does a practical technology growth roadmap look like?
- What institutions and policymakers must do to enable tech-driven growth
- What are the real risks of technology-driven growth?
- How should you measure technology-driven growth?
- Three U.S. case studies that show the playbook in action
- The mindset shift most leaders still haven’t made
- POW IT UP turns technology strategy into measurable results
- Sources
- FAQ
How does technology actually drive business growth?
Technology raises output per unit of input. That’s the core mechanism, and it plays out through five distinct channels that compound on each other.
Productivity gains come first. Automating repetitive, rules-based work frees human capacity for higher-value tasks. A loan-processing team that manually reviews 200 applications a day can handle multiples of that volume when document intelligence handles extraction and validation. The labor input stays flat; the throughput scales.
Process automation goes deeper than productivity. It restructures the cost curve. When a process that once required ten people runs on two with AI oversight, the margin improvement is structural, not cyclical. That margin funds the next wave of investment.
Product innovation is the third channel. Technology enables entirely new offerings — predictive maintenance as a service, real-time personalization, outcome-based pricing — that open revenue streams that didn’t exist before. The transformation of AI in business operations is creating these new models across every sector.
Platform effects amplify all three. A digital platform that connects buyers, sellers, and data generates network value that grows non-linearly with each new participant. That’s why platform businesses consistently achieve higher revenue multiples than traditional service firms.
Market expansion closes the loop. Cloud infrastructure removes geographic constraints. A mid-market firm in Ohio can serve clients in Texas, California, and internationally without a proportional increase in overhead.
Research from the American Economic Association notes that automating intelligence could raise growth rates materially, but faces “weak link” constraints — meaning that productivity gains from AI depend on automating many supporting tasks simultaneously, not just the headline process. Leaders who plan for those weak links in their roadmaps realize gains faster than those who don’t.
A note on employment effects: Firm-level research consistently finds that product and process innovation drive strong sales growth while employment effects are more moderate and sensitive to institutional conditions. Revenue growth does not automatically translate into proportional job creation — a reality that economic-development professionals must factor into regional planning.
For regional economic developers, the policy implication is direct: infrastructure and absorptive capacity (workforce skills, broadband, access to credit) determine how quickly private technology investment converts into regional income gains. Build those foundations first.
Which technologies should you prioritize right now?
The selection criteria are straightforward: value-to-cost ratio, speed-to-value, and scalability. A technology that delivers measurable ROI within 90 days and scales without a linear cost increase earns priority. Here are the six that consistently clear that bar:
- AI and machine learning — document intelligence, predictive analytics, and autonomous decision support reduce cycle time and error rates across finance, operations, and customer service.
- Cloud and customer data platforms — unified data architecture is the prerequisite for every other technology on this list. Microsoft’s vision for integrated customer data platforms illustrates why a clean data layer enables AI and automation to function at scale.
- Robotic process automation (RPA) and intelligent automation — high-volume transactional work (invoice processing, compliance checks, data entry) is the fastest path to measurable cost reduction. See the full range of service business automation tools available today.
- Internet of Things (IoT) — real-time sensor data from equipment, facilities, or supply chains enables predictive maintenance and dynamic resource allocation, turning reactive operations into proactive ones.
- Large language models (LLMs) and generative AI — contract review, knowledge retrieval, customer communication drafting, and code generation are all production-ready use cases with measurable time savings.
- Platform ecosystems and APIs — connecting internal systems and third-party services through well-designed APIs creates the integration layer that makes convergence possible.
Pro Tip: Sequence matters more than selection. Start with data architecture and cloud, then layer automation on clean data, then add AI on top of automated workflows. Reversing that order — deploying AI before the data layer is clean — is the single most common reason pilots fail to scale.
Why convergence is the real engine of modern growth
Single technologies produce incremental gains. Convergence produces step changes. That’s the argument the World Economic Forum makes with its 3Cs framework, and the evidence behind it is hard to argue with.
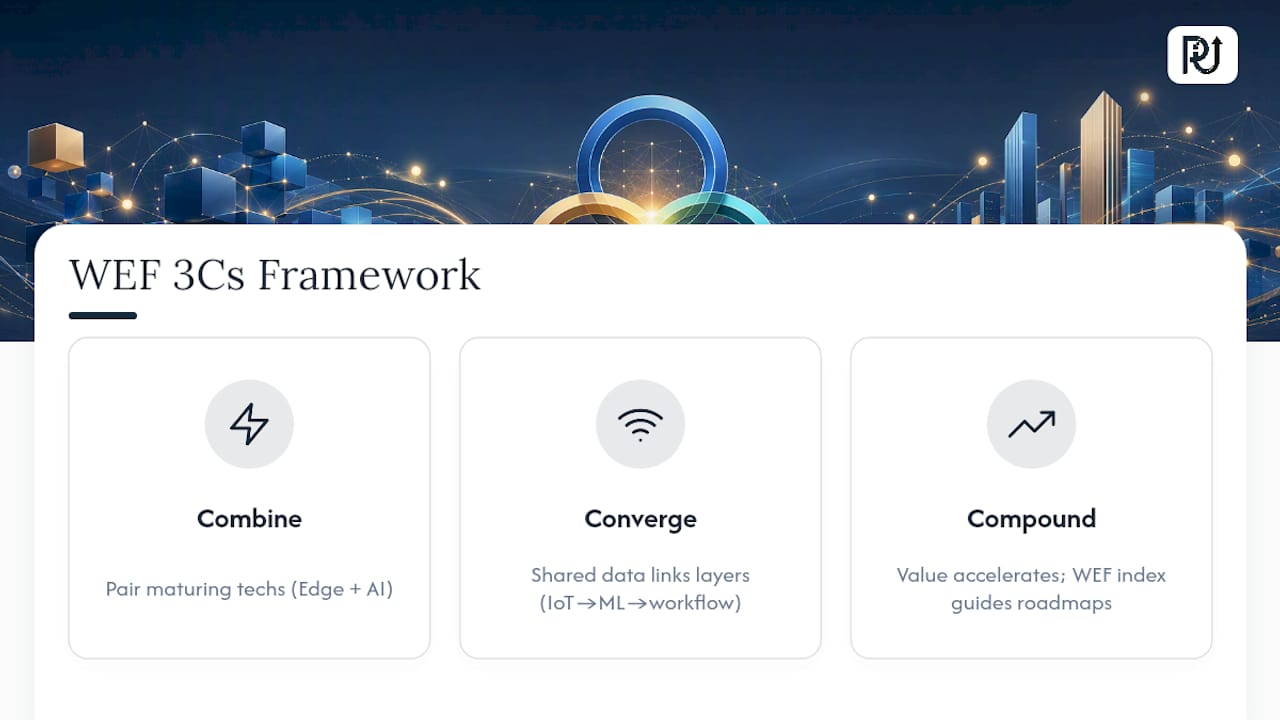
Combine means pairing two or more maturing technologies to create a capability neither delivers alone. Edge computing combined with AI inference, for example, enables real-time decision-making at the point of data collection — without a round-trip to the cloud.
Converge means designing systems where those combined technologies share data and reinforce each other’s outputs. An IoT sensor network that feeds a machine learning model that triggers an automated workflow is a converged system. Each layer makes the others more valuable.
Compound is what happens over time. As each technology matures and the integration deepens, the value generated accelerates. The WEF’s maturity index approach helps organizations identify which technologies are nearing commercialization and therefore most likely to compound value when combined — a practical tool for roadmap planning.
A concrete example: industrial predictive maintenance. A manufacturer deploys vibration sensors (IoT) on critical equipment. Those sensors feed a machine learning model (AI) that predicts failure probability. When the model flags a threshold, an automated work order (RPA) is generated and routed to the maintenance team. The outcome is not just fewer breakdowns — it’s a shift from time-based to condition-based maintenance, which typically cuts unplanned downtime significantly and reduces parts inventory requirements. No single technology in that stack delivers the full result. The convergence does.
Leaders who design roadmaps around convergence — rather than around individual technology purchases — build compounding advantages. Those who don’t tend to accumulate disconnected tools that each require separate maintenance and deliver diminishing returns.
What does a practical technology growth roadmap look like?
Prioritization is the hardest part. Gartner’s guidance for tech CEOs is direct: align your growth strategy to your current stage, pick one major growth bet per cycle, and avoid “strategic dilution” — the trap of spreading investment across too many initiatives simultaneously. Every bet you add beyond one dilutes the focus, the talent, and the capital behind the primary initiative.
A value-versus-feasibility matrix helps make that choice concrete:
| Quadrant | Value | Feasibility | Recommended action |
|---|---|---|---|
| Quick win | High | High | Execute immediately — fund and staff fully |
| Strategic bet | High | Low | Pilot with a small team; build toward scale |
| Low-hanging fruit | Low | High | Automate and maintain; don’t over-invest |
| Deprioritize | Low | Low | Defer or drop entirely |
Most organizations have initiatives spread across all four quadrants. The discipline is moving resources from the bottom two rows to the top row.
The 90-day pilot checklist
A well-scoped pilot de-risks the strategic bet before full commitment. Run it in this sequence:
- Define scope — one process, one business unit, one measurable outcome. Narrow is better.
- Confirm data access — identify the data sources the pilot needs and verify quality before building anything.
- Set success metrics — cycle time reduction, error rate, cost-per-transaction, or adoption rate. Pick two or three, not ten.
- Establish governance — assign a data steward, define security requirements, and document the decision rights for the pilot team.
- Decide build vs. buy — evaluate whether a productized solution covers 80% of the use case before committing to custom development.
- Staff the core team — a business owner, a technical lead, and a change management lead. Three roles minimum; no committee.
On the build-versus-buy question: productized AI and automation tools cover a wide range of standard use cases and typically reach production faster than custom builds. Custom development earns its cost when the use case is proprietary, the data is unique, or the competitive advantage depends on the specific implementation. For governance, a one-line checklist covers the essentials: data ethics policy, security classification, SLA for uptime and incident response, and a defined owner for ongoing operations.
What institutions and policymakers must do to enable tech-driven growth
Private technology investment delivers regional benefits only when the surrounding institutional environment can absorb it. Brookings frames this clearly: science, technology, and innovation policies expand opportunity when paired with workforce development and institutional supports — not in isolation.
The CEPR’s research on technology adoption and diffusion quantifies the mechanism: absorptive capacity — the combination of education levels, management practices, and access to credit — materially affects how quickly firms adopt frontier technologies and therefore how quickly regional income levels respond to technology investment. A region with strong broadband infrastructure but a workforce without digital skills captures only a fraction of the available gains.
Workforce training is the highest-leverage policy action. Programs that pair technical skills (data literacy, automation tooling, AI prompt engineering) with domain expertise in manufacturing, healthcare, or logistics produce workers who can actually implement and maintain technology systems — not just use them.
R&D incentives accelerate private investment. Federal policies such as R&D tax credits and innovation grants are mechanisms that can reduce the cost of technology development for firms that might otherwise underinvest.
Broadband and cloud infrastructure remain uneven across US regions. The CHIPS and Science Act and the Broadband Equity, Access, and Deployment (BEAD) program represent federal commitments to close that gap — both are relevant reference points for economic-development professionals designing regional strategies.
Public-private pilots — where a regional development authority co-funds a technology pilot with a local employer — create demonstration effects that accelerate adoption among neighboring firms. The evidence base for this approach is strong in manufacturing extension programs like the Manufacturing Extension Partnership (MEP) network.
For measurement: economic-development teams should track firm-level technology adoption rates, broadband penetration, workforce digital-skills certification rates, and new private technology investment attracted per year. These four metrics together describe a region’s absorptive capacity trajectory.
What are the real risks of technology-driven growth?
Technology raises revenue and productivity. It also produces uneven distributional effects that require deliberate management. Ignoring the second half of that sentence is how leaders and policymakers end up surprised by outcomes they could have anticipated.
The Annual Reviews macroeconomic literature is clear that large-scale automation can alter the labor share of income — meaning productivity gains accrue disproportionately to capital rather than workers, depending on the direction of technical change and returns to scale. That’s a policy and business reality, not just an academic concern.
Core risks to manage:
- Job displacement and skill mismatches — automation eliminates specific tasks faster than workers can reskill without active intervention. Phased automation timelines and parallel reskilling programs reduce this gap.
- Regional inequality — technology investment concentrates in areas with existing absorptive capacity, widening gaps between high- and low-capacity regions without deliberate policy counterweights.
- Market concentration — platform effects and AI advantages tend to favor incumbents and well-capitalized firms, raising barriers to entry for smaller competitors.
- Cybersecurity exposure — every new integration point is a potential attack surface. The more converged a system, the more a single breach can cascade.
- AI misuse and governance failures — autonomous systems making consequential decisions without adequate oversight create liability and reputational risk.
Practical mitigation strategies for leaders:
- Build reskilling programs alongside automation deployments, not after them.
- Use inclusive procurement criteria that favor vendors with demonstrated workforce transition practices.
- Implement a responsible-AI governance framework before deploying autonomous decision systems — define what decisions require human review and at what confidence threshold.
- Treat cybersecurity architecture as part of the technology roadmap, not a separate workstream.
- Conduct a distributional impact assessment for any automation initiative that affects more than 10% of a workforce.
On revenue versus jobs: Firm-level evidence from MDPI’s innovation and growth research shows that product and process innovation drive strong sales growth while employment effects are positive but smaller and conditional on institutional conditions. Leaders who plan headcount reductions based on revenue projections alone tend to underestimate the institutional and reputational costs of rapid workforce displacement.
How should you measure technology-driven growth?
Measurement ties investment to outcomes. Without it, technology spending is faith-based. The framework below organizes KPIs by stakeholder so each leader tracks what they can actually influence.
CEO-level KPIs: Annual recurring revenue (ARR) growth rate, gross margin expansion, revenue per customer, and new market revenue as a percentage of total revenue. These measure whether technology is creating new value, not just reducing cost.
COO-level KPIs: Process cycle time (before and after automation), error rate per transaction, cost-per-transaction, and system uptime. These measure operational efficiency and the reliability of automated systems.
Economic-development director KPIs: Firm technology adoption rate (percentage of firms in the region using cloud, AI, or automation tools), new private technology investment attracted (dollars per year), broadband penetration rate, and workforce digital-skills certification rate.
A practical dashboard has four panels, refreshed on different cadences:
- Adoption metrics (monthly): user adoption rate, process coverage percentage, integration uptime.
- Financial impact (quarterly): cost-per-transaction trend, margin contribution from automated processes, ARR growth attributed to new technology-enabled offerings.
- Risk indicators (monthly): security incident count, AI decision override rate, compliance exceptions.
- Talent pipeline (quarterly): reskilling program enrollment, digital-skills certification completions, open technical roles versus filled.
The operational efficiency guide for leaders covers how to build this measurement infrastructure in practice, including how to baseline pre-automation metrics so post-deployment comparisons are credible.
Three U.S. case studies that show the playbook in action
These examples illustrate what technology-driven growth looks like when the playbook runs correctly — across different firm sizes and sectors.
Enterprise fintech: automating document-intensive workflows
A mid-sized financial services firm processing thousands of loan applications monthly faced a bottleneck in document review and data extraction. The firm deployed AI-based document intelligence to automate extraction, validation, and routing. The result was a significant reduction in processing cycle time and a measurable drop in error rates, allowing the same team to handle higher application volumes without adding headcount. The lesson: document intelligence delivers fast, measurable ROI in any process where humans are reading and re-keying structured data. For automation ROI examples in service businesses, the pattern repeats across industries.
Regional economic development: manufacturing extension and AI adoption
A Midwest manufacturing cluster, supported by a Manufacturing Extension Partnership (MEP) affiliate, ran a co-funded pilot connecting IoT sensors on production equipment to a cloud-based analytics platform. Participating firms tracked equipment utilization and failure patterns in real time. Within six months, several firms reported reductions in unplanned downtime. The broader lesson for economic-development professionals: co-funded pilots with a shared infrastructure layer lower the adoption barrier for smaller manufacturers who can’t justify the investment alone. Sector-level diffusion data — such as adoption counts tracked by Statista across industries like medical 3D printing — illustrates how unevenly technology spreads without deliberate facilitation.

SMB scaling with AI agents
A professional services firm with 40 employees was spending a disproportionate share of staff time on client onboarding, status updates, and routine reporting. The firm deployed custom AI agents to handle intake forms, generate status summaries, and route client inquiries. Staff capacity freed up shifted toward billable work. Revenue per employee increased without adding headcount. The lesson: AI agents deliver the highest ROI in SMBs when deployed on the highest-frequency, lowest-complexity interactions first — not on complex judgment calls.
The mindset shift most leaders still haven’t made
Most leaders treat technology as a cost-reduction tool. That framing is not wrong — it’s just incomplete, and it’s the reason so many technology programs plateau after the first wave of efficiency gains.
The leaders who compound their advantages think differently. They ask not “how do we automate this process?” but “how do we productize this capability?” When a firm automates its own document processing, that’s an efficiency gain. When it packages that capability as a service it sells to other firms in its industry, it has created a new revenue stream. The internal automation becomes a product. That shift — from cost center to revenue engine — is what separates firms that grow through technology from firms that merely run more efficiently.
Gartner’s guidance on avoiding strategic dilution reinforces this: the leaders who pick one growth bet per cycle and resource it fully outperform those who spread investment across five initiatives. The discipline to say no to the fourth and fifth initiative is harder than it sounds when every technology vendor is promising transformative results.
The other mistake is treating the 90-day pilot as the destination rather than the starting gate. A pilot that succeeds and then sits in a single business unit for two years is a missed compounding opportunity. The scale plan should be written before the pilot launches, not after it succeeds.
Pro Tip: Before your next technology investment decision, map the “weak links” in the process you’re automating — the adjacent manual steps that will become the new bottleneck once the primary process is automated. The AEA’s research on AI and economic growth identifies this as the primary reason automation programs underdeliver: the headline process gets automated, but the surrounding tasks don’t, and the bottleneck simply moves.
POW IT UP turns technology strategy into measurable results
The playbook in this guide works. The gap between knowing it and executing it is where most organizations stall — not from lack of strategy, but from lack of the technical architecture to make convergence real.

POW IT UP designs, builds, and deploys custom digital workforces for enterprise and mid-market leaders who need more than a generic integration. The firm’s AI agents handle high-volume transactional operations — document processing with DocuPOW, portfolio monitoring with AuraPOW, and bespoke workflow orchestration built to your specific data environment. The engagement model follows the playbook directly: a scoped pilot with agreed KPIs, a 90-day evaluation period, and a scale plan that’s ready before the pilot closes.
For leaders ready to move from strategy to execution, the starting point is a demo of the AI integration services or a conversation with the team about your specific automation priorities. If you’re evaluating where intelligent automation fits in your stack, the AI automation services page covers the full range of engagement options.
Sources
The sources below were selected for policy authority, empirical rigor, and practitioner relevance. Each supports a specific claim in this guide.
- Why technological convergence should be your growth strategy | World Economic Forum
- Promoting Opportunity and Growth through Science, Technology, and Innovation | Brookings
- Innovation and Firm Growth: Evidence from an Emerging Economy | MDPI
- AI and Our Economic Future – American Economic Association
- Effective Growth Strategy for Tech CEOs: Key Insights | Gartner
- Economic Growth — Annual Reviews
- CEPR discussion paper on technology adoption and diffusion
- Statista: medical 3D printing facilities in U.S. hospitals
FAQ
How does technology impact business growth?
Technology raises output per unit of input through productivity gains, process automation, product innovation, and platform effects. Research from the American Economic Association confirms that automating intelligence can raise growth rates materially, though realizing those gains requires addressing the “weak link” constraints in surrounding processes.
Which industries are seeing the fastest technology-driven growth right now?
Financial services, healthcare, and manufacturing are seeing the fastest adoption of AI and automation tools in the US, driven by high transaction volumes, regulatory pressure to reduce errors, and the availability of productized AI solutions for document processing and predictive analytics.
What is the 3Cs framework for technological convergence?
The World Economic Forum’s 3Cs framework describes how growth accelerates when organizations combine maturing technologies, converge them into integrated systems, and allow the compounding effects to build over time. It argues that convergence, not isolated breakthroughs, is the primary engine of modern growth.
How do you measure the ROI of a technology growth initiative?
Track two to three KPIs tied directly to the pilot’s scope: cycle time reduction, cost-per-transaction, and error rate for operational pilots; ARR growth and revenue per customer for product-level initiatives. Set baseline measurements before the pilot launches so post-deployment comparisons are credible.
What is the biggest mistake leaders make with technology investments?
Gartner’s research identifies “strategic dilution” — spreading investment across too many initiatives simultaneously — as the primary reason technology programs stall. Picking one major growth bet per cycle and resourcing it fully consistently outperforms a portfolio of underfunded initiatives.